For those who are curious about what HEARTCOUNT is…
This article is written to introduce what HEARTCOUNT is, what differentiates HEARTCOUNT from other similar tools, and how it can help you.
💡 What is HEARTCOUNT?
- An easy-to-use data analysis tool for everyone
- Free visualization feature! Self-service analysis tool
- Free learning content provided, learn with Ada's Webinar Series
- The beginning of democratizing data, enterprise analytics+BI solution
1. An easy-to-use data analysis tool for everyone
Without good tools, we can become tools ourselves. HEARTCOUNT is a tool that allows ordinary people to utilize data even without professional knowledge in the field. With the EDA feature, you can observe data in a macro/micro perspective and confirm quantitative facts and relationships between variables. With the Augmented Analytics feature, you can automatically discover the structure and order of data.
2. Free visualization feature! Self-service analysis tool
In the free version, EDA function is provided, and in the paid version, both EDA and Augmented Analytics functions are available.

- EDA: You can use Excel and csv files to visualize data and perform Exploratory Data Analysis. Login with your Google account and use all visualization features of HEARTCOUNT for free for life.
- Augmented Analytics: A premium feature provided to paid customers that automatically finds patterns and provides them in natural language. (Starting at 300,000 won per year, one-month free trial available.)
👉 Learn more about HEARTCOUNT pricing policy

a. Refined and Richer analysis by processing automatic patterns and derived variables.
What is automatic derived variable processing?
In HEARTCOUNT, automatic derivation of variables means dividing the entire range of a numerical variable such as age, which is composed of 1, 5, 13, 10, 20, into intervals such as 1–5, 5–10, and 1–15 or percentiles (relative position) such as the top 20% and the bottom 20%. For dates, HEARTCOUNT automatically generates related derived variables such as quarter/season/month/day of the week without manual processing.

What are the benefits of derived variables?
- When a numerical variable is automatically processed into a categorical variable, non-linear patterns can be found, and more intuitive visual representations can be made. That is, patterns that were not visible with numerical variables can be confirmed through categorical variable processing.
- For more information on creating categorical categories from numerical variables, click here.
- For date/time variables, seasonal and cyclic patterns can be identified.
- For more information on derived variables using time/date variables, click here.
b. EDA like no other
What is Exploratory Data Analysis (EDA)?
- EDA is the act of examining data in various forms on a graph to visually verify or create new hypotheses by verifying non-visualized patterns before analyzing data.
- If you want to know more about EDA, refer to the related blog post.
HEARTCOUNT’s unique strengths in EDA and data visualization are as follows.
What are the strengths of HEARTCOUNT in terms of EDA?
Visualization is possible at the individual record level of millions of individual records!

- If visualization with aggregated data such as bar charts or line charts is considered abstraction, visualization of individual record-level data is minutiae that reveals patterns that could not be seen in summary data.
- Visualization of individual records at a level of over millions of records, which even visualization tools like Tableau or PowerBI cannot achieve, is possible in HEARTCOUNT.
- For more information on visualizing individual record levels, click here.
c. Augmented Analytics for factors and optimization of KPI changes
HEARTCOUNT Premium Feature — Augmented Analytics/Advanced Automated Analysis
What is Augmented Analytics?
There may not be one correct method or procedure for data-based decision-making, but there are methods and procedures that skilled analysts usually perform to find patterns. Augmented Analytics is a technology and service that automates the manual analysis process of analysts to automatically find useful patterns.
Automatic Pattern Finding — From factors of KPIs to optimization methods
- Without hypotheses, analysis is performed on all combinations of variables for key performance indicators (KPIs) to provide patterns that can improve KPIs in a friendly manner.
- The results of the analysis performed without hypotheses are provided statistically significant and in order of factors that have a significant impact on KPIs, complementing the limitations of users familiar with data viewing from a familiar perspective and vision.
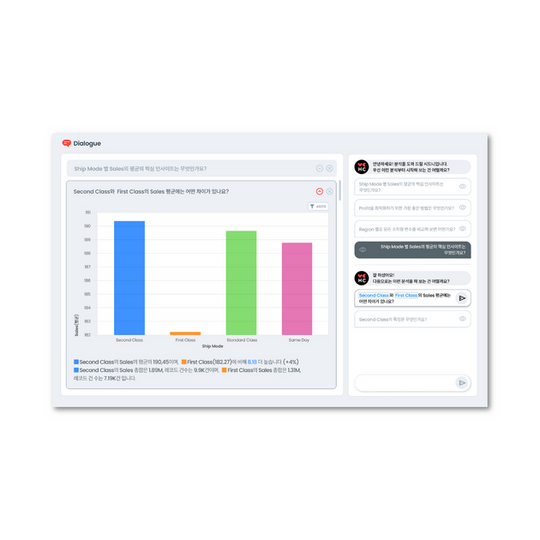
NLQ (Natural Language Query) — Search like Google and we’ll provide relevant results.
- Just like searching with Google, if you ask a question with natural language (NLQ: Natural Language Query), it finds patterns automatically and provides analysis results summarized in natural language.
- For more information, click here.
For more information on Premium Feature Augmented Analytics, click here.
d. Upload and analyze sensitive data wherever you are

- If you only perform EDA after uploading a dataset (free version users), it will not be uploaded to the HEARTCOUNT server and will disappear when the session ends in the user’s PC’s browser.
- If you save the campaign after performing EDA (paid version users), the dataset is uploaded to the HEARTCOUNT server. Even in this case, if you set the ‘data obfuscation’ flag along with the campaign save, only obfuscated data will be uploaded to the server so that the actual dataset is not leaked. Don’t worry if you couldn’t use cloud data analysis tools due to strict internal security policies!
- Learn more about the obfuscation feature.
3. Data Analysis/Visualization Community, DDMA
Don't Data Me Alone(DDMA) is a Korean-based community, we are currently working on channels for global users!
We provide educational contents (online VOD, practice examples, etc.) to help with tool learning and utilization.
If you join the Slack, you can receive new content notifications via email.
- Communicate with about 1,000 practitioners through the DATA HERO community operated through Slack.
- Find out how other practitioners with similar concerns analyze and utilize data.
- Various programs such as webinars, offline meetups, one-month intensive education camps, and studies are prepared.
- You can get various help, such as communication with the product team in charge of HEARTCOUNT use, customer support, and utilization cases of other users, to overcome strict internal security policies against cloud data analysis tools.
4. BI + HEARTCOUNT for enterprises

HEARTCOUNT ABI is a product that integrates BI and Analytics functions, connects to a company’s data repository (DB, DW), creates dashboards, and automatically links related datasets for EDA and advanced analysis when questions arise regarding indicators/charts.
👉 Want to know more about enterprise products?
👉 Meet your data friend, HEARTCOUNT. (Log in)
If you want more detailed information about the product, please contact us at support@idk2.co.kr.
📚 More articles from the Heartcount team.
❓ Consult on Heartcount implementation.
💬 Join the community for practitioners of data analysis and visualization.