In the real world, you often need to find the key characteristics in your data that separate two groups of people. For example, an HR department might want to identify the key characteristics that separate high performers from low performers, an operations department might want to understand where the differences come from between stores that are doing well and those that are not, or a marketing department might want to understand the segment characteristics of those who responded to a recent campaign (compared to those who didn't).
Write a captionThe Titanic survivor dataset is a well-known dataset in the data science community. It contains information about the passengers on board the Titanic ship, including their age, gender, passenger class, fare, and whether they survived or not. In this report, we will perform an advanced analysis with HEARTCOUT on the Titanic survivor dataset to determine which attributes (variables) of the passengers on the Titanic are key to differentiating between the two groups; those who survived and those who died.To use this dataset:
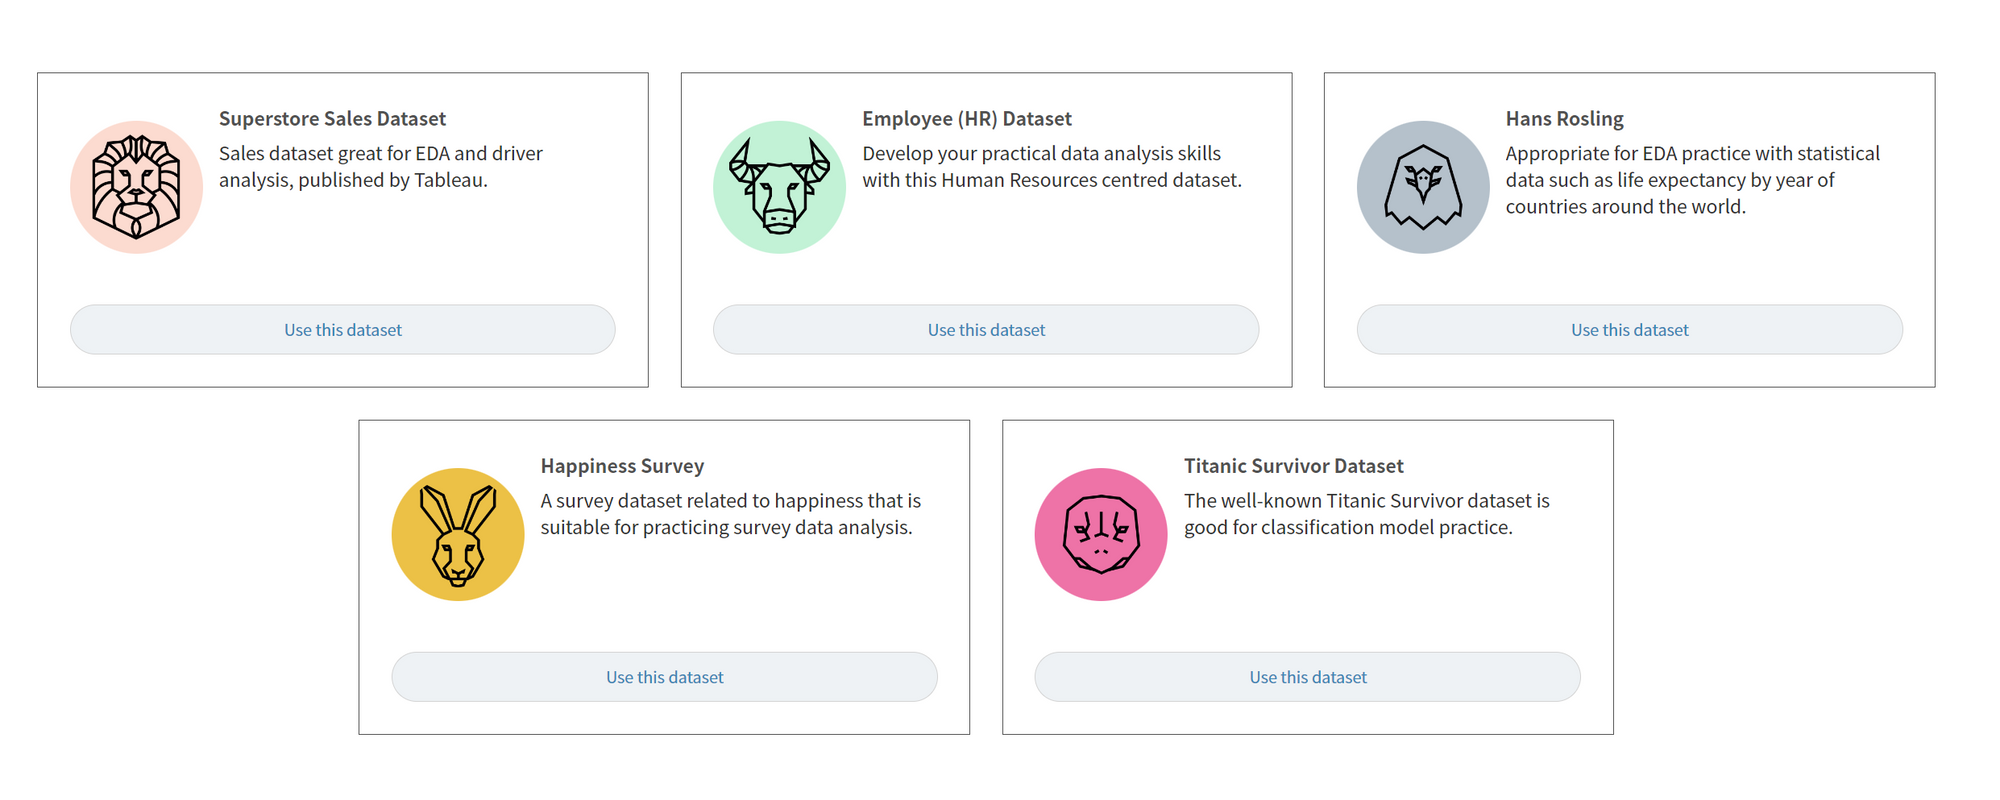
- Log in to https://www.heartcount.io/da/new_campaign
- Create new campaign and click
Use a sample dataset - Click "Titanic Survivor Dataset" ready-to-use.
Write a captionIn the figure below, suppose we have color-code the survivors as blue and the dead as orange, and then visualize the distribution of each group by age. It's easy to see that the survivors are older overall (the age distribution of the blue group is skewed to the right), and we can guess that the age variable might be useful in distinguishing between the two groups.
However, as there are many other attributes (variables) that can be used to distinguish between the two groups, such as gender and ticket type, the relative importance of these attributes cannot be determined visually.
💡 AUC
AUC stands for Area Under Curve, which is the area under the line - the ROC curve - that connects the points on the right graph in the distribution of two given populations where the proportion of True Positives (those who were predicted to survive and actually did) and False Positives (those who were predicted to survive but actually died) varies depending on what the cutoff (vertical straight line on the left) is (age 20, 25, etc.).
Given the distributions of two populations, we can say that the larger the *AUC, the better the variable can discriminate between the two populations. As shown in the figure below, if the distributions of the two populations do not overlap (or intersect), the AUC is equal to 1. (An AUC of 1 means that the variable can perfectly discriminate between the two populations).
💡 AUC is often used to comprehensively evaluate the performance of a model (logistic model, decision tree, etc.) that classifies different populations.
Advanced Analysis in HEARTCOUNT
a. Difference Analysis
Finding characteristics that distinguish the survivors of the Titanic from the victims.
From a practical standpoint, understanding the differences between two populations serves two purposes:
- Understanding the relative importance of individual variables (e.g., the most prominent characteristic of stores with high profit is a low turnover rate among employees).
- Finding combinations of variables with a high degree of purity (e.g., stores with a turnover rate of 15% or less and a delivery share of 30% or less had a 90% chance of being in the top 20% of stores by net profit).
Below, we'll take a quick look at how to use HEARTCOUNT's Difference Analysis feature to determine the relative importance of variables in categorizing two groups.
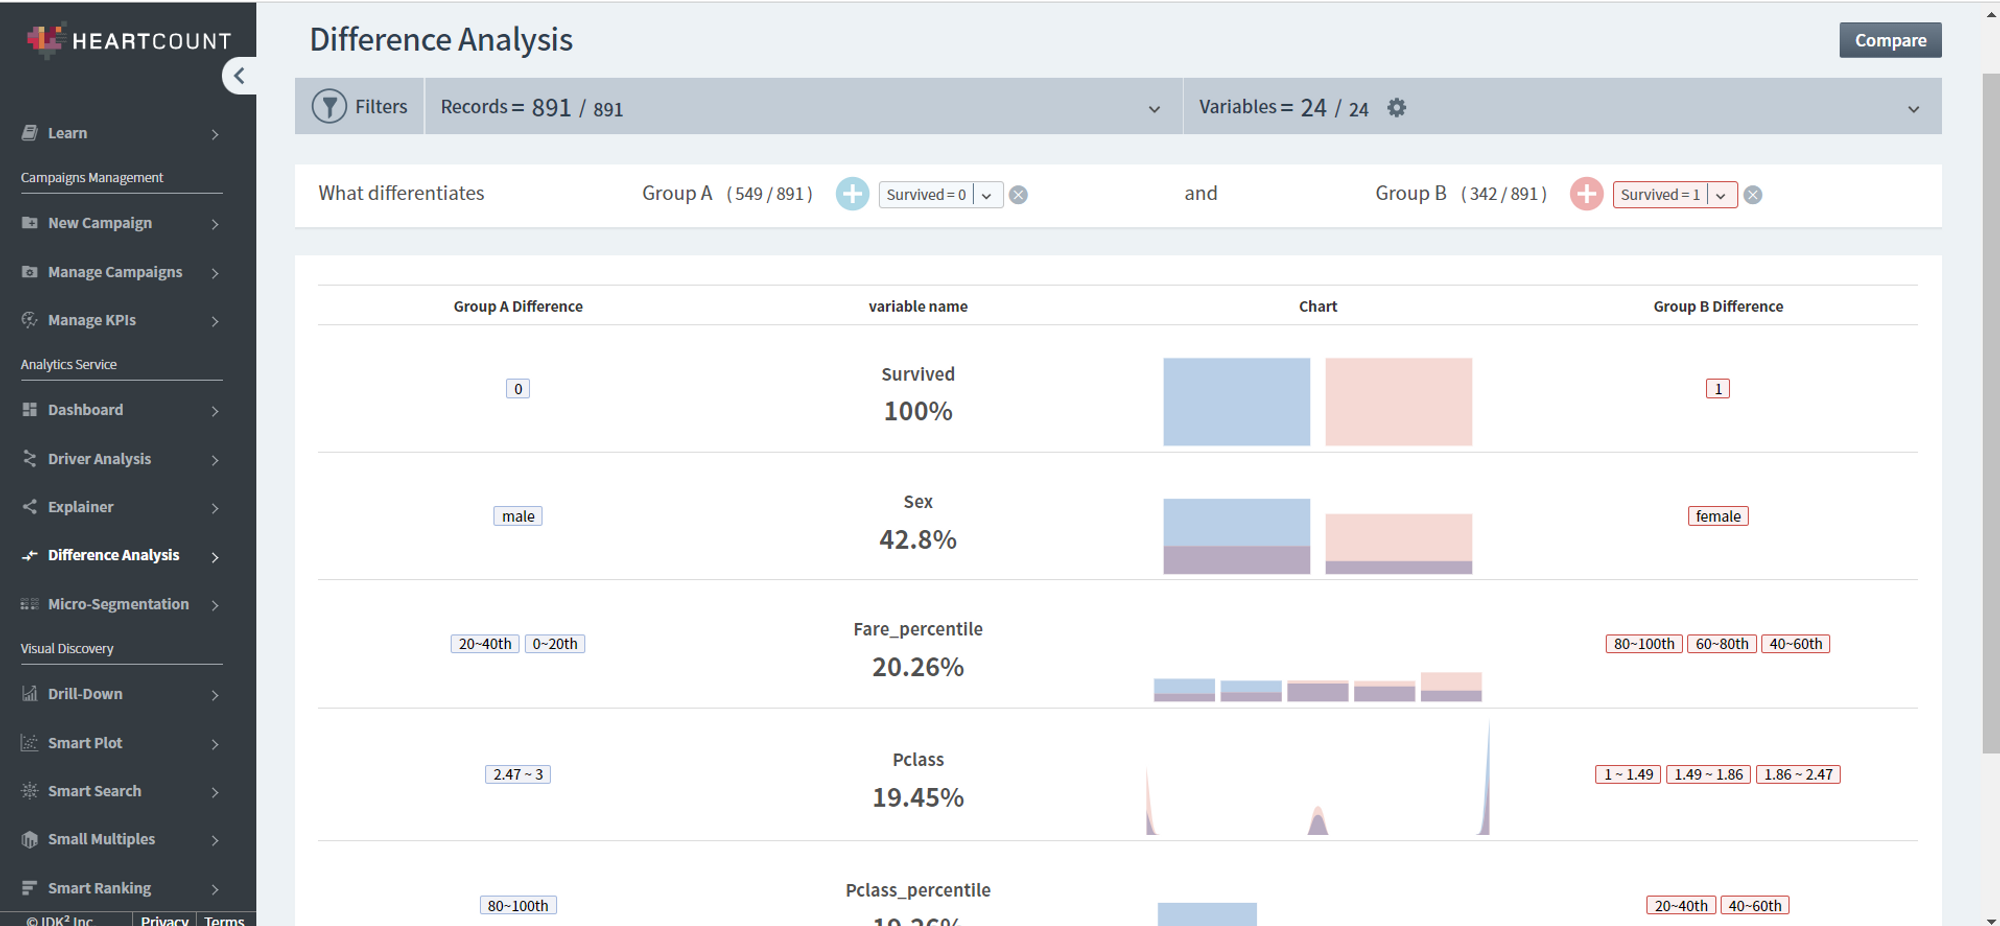
- 1.Set Group A and Group B as the two populations whose characteristics you want to understand differences in. In our example, we set deaths (Survived=0) for Group A and survivors (Survived=1) for Group B.
- 2.When you have finished setting up the groups, click the [Compare] button.
Now, let’s interpret the results.
- Survived 100%: The top result is the (target) variable "survived", which indicates whether a person is alive or dead, and (unsurprisingly) we can see that the two groups are 100% separated by that variable.
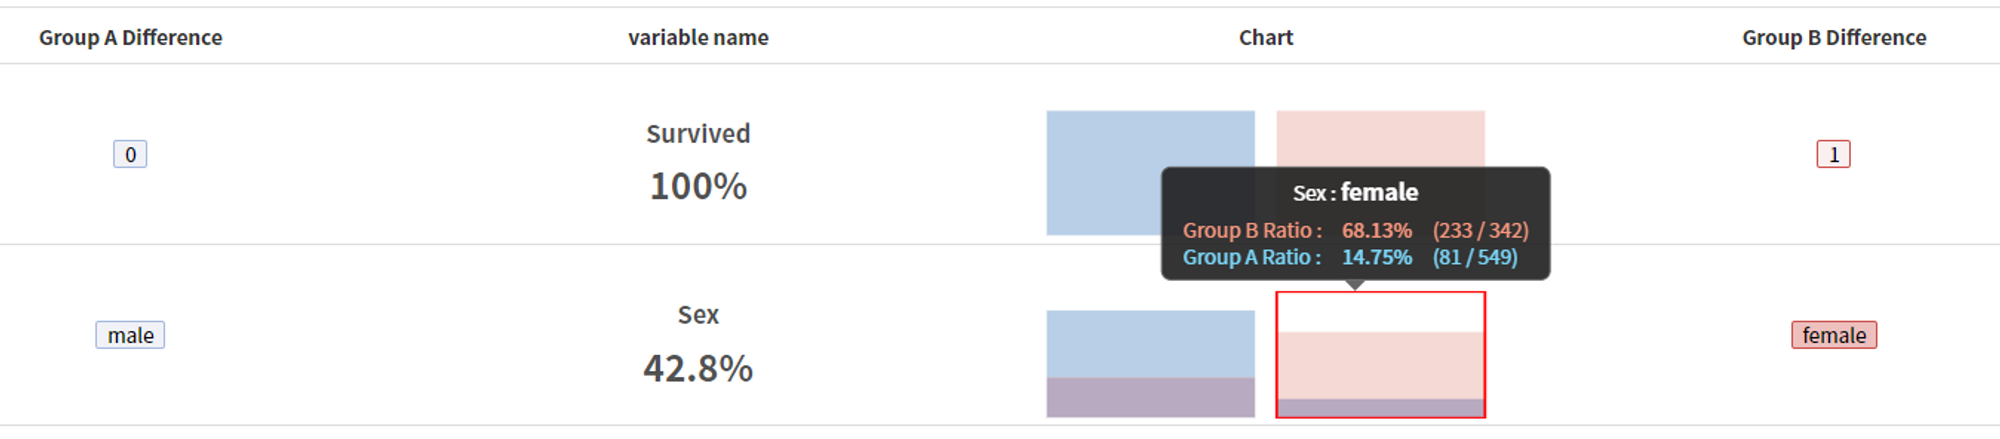
- sex, female: Since gender is the main variable that separates the two groups, and 68.13% of the survivors (group B, represented in red) were female, while only 14.75% of the deceased (blue, group A) were female, we can say that female is the dominant characteristic of the survivors.
- The number 42.8% separates survivors and victims by gender(female, male), meaning that the percentage of the area where the distributions do not overlap is approximately 42.8% (purple indicates overlap). We use an algorithm called "Kullback-Leibler divergence" internally to calculate the difference between the two distributions quantitatively (changed slightly), so 42.8% is a metric to gauge the relative importance of the variable in separating the two populations.
In summary, this information is important because it suggests that gender have played a main role in a passenger's survival.
b. Micro-Segmentation
Moving on, HEARTCOUNT's Micro-Segmentation feature can be used to categorize survivors and deceased using a decision tree algorithm.
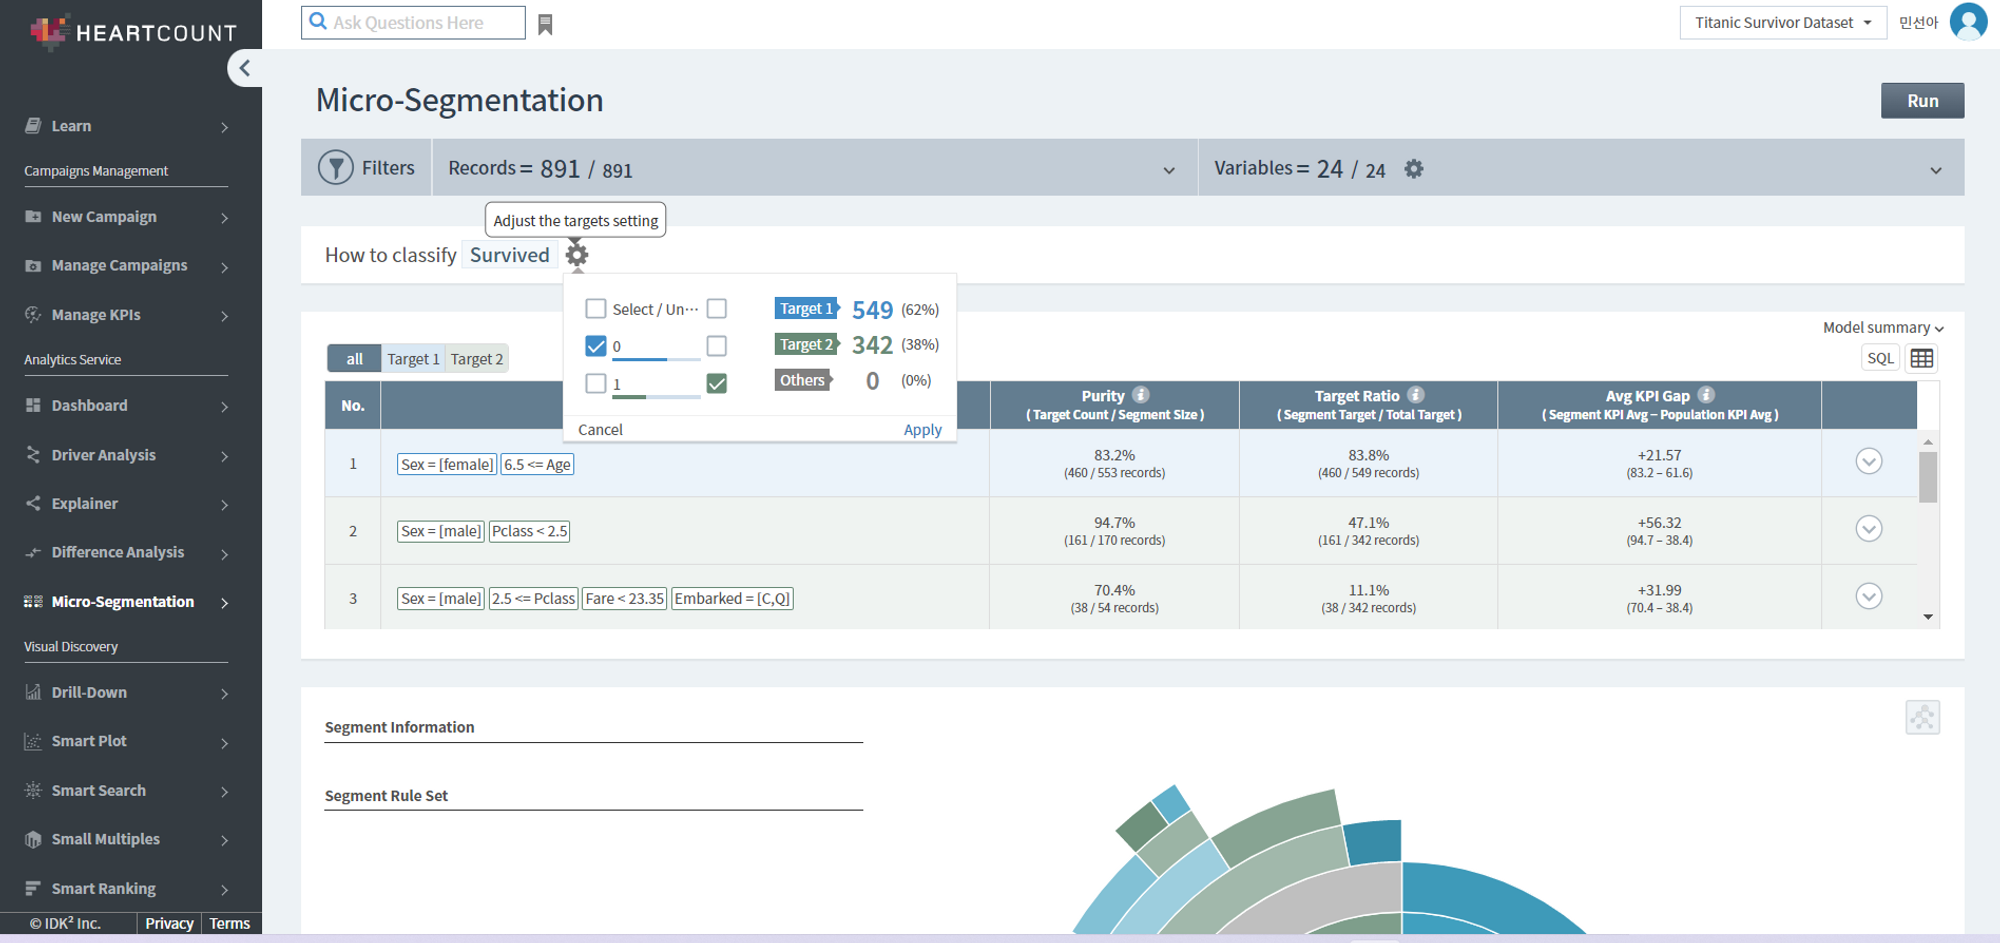
Select "Survived" as the target variable and click the [Analyze] button to generate a model that categorizes survivors (1) and deceased (0).Another factor that may have influenced a passenger's survival is their class. Let’s analyze the results with a tree model. (green: survivors, blue: deceased).
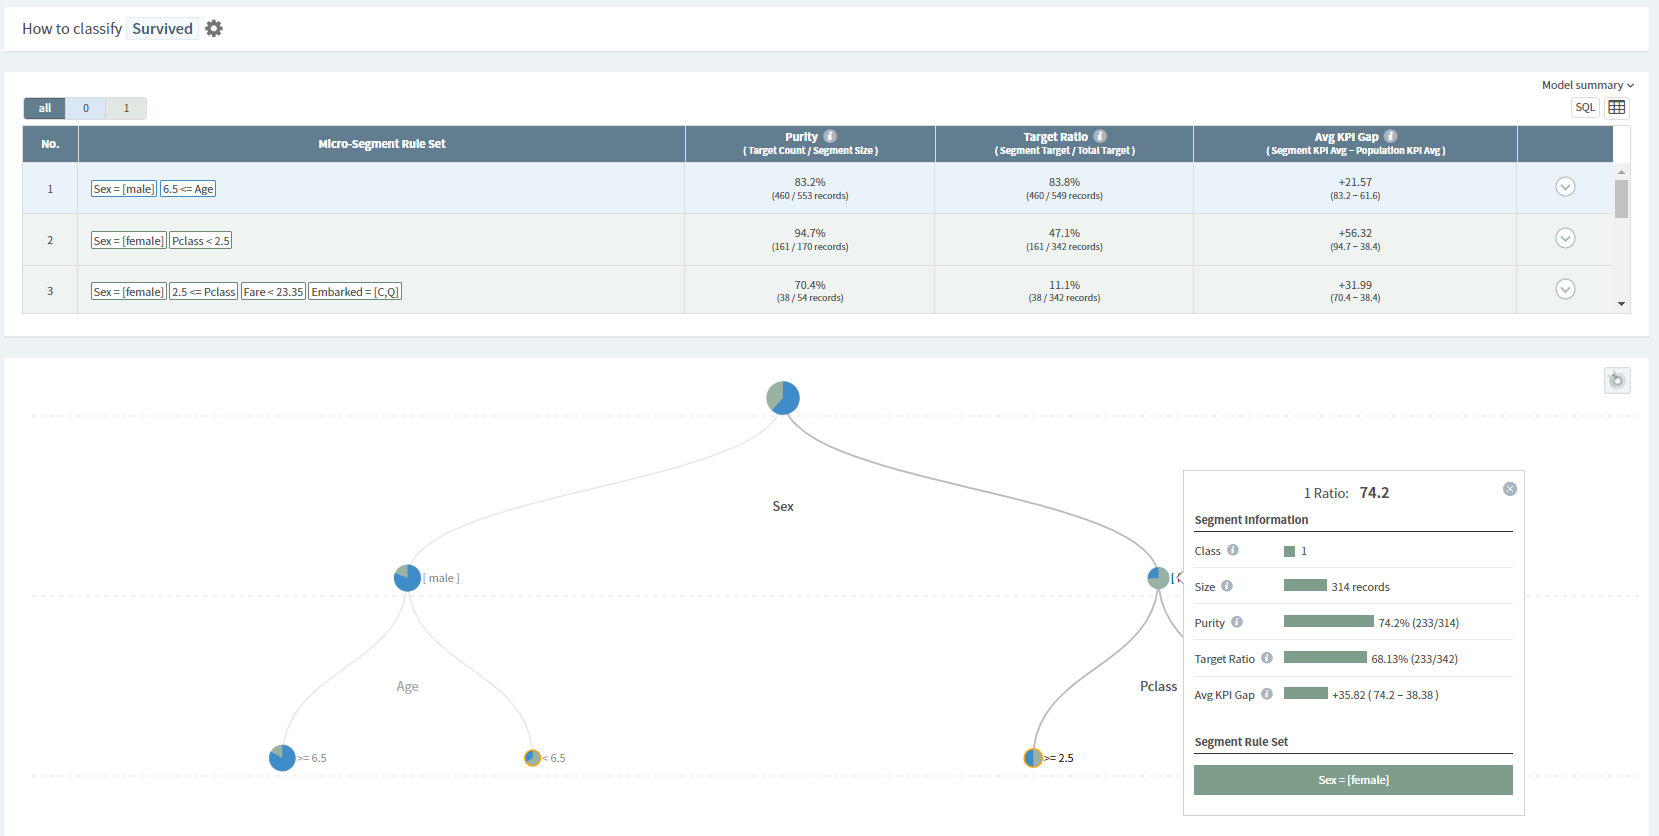
- For females, the survival rate (percentage of survived=0) was 74.2%.
- The Titanic survivor dataset contains information about the passenger's class, with 1 being the highest class and 3 being the lowest.
- If you are female and also traveling in 1st or 2nd class (pclass < 2.5), the survival rate is 94.7% (this is the result of specifying pclass as a number when creating the campaign, you may get different results if you select pclass as a category when creating the campaign).
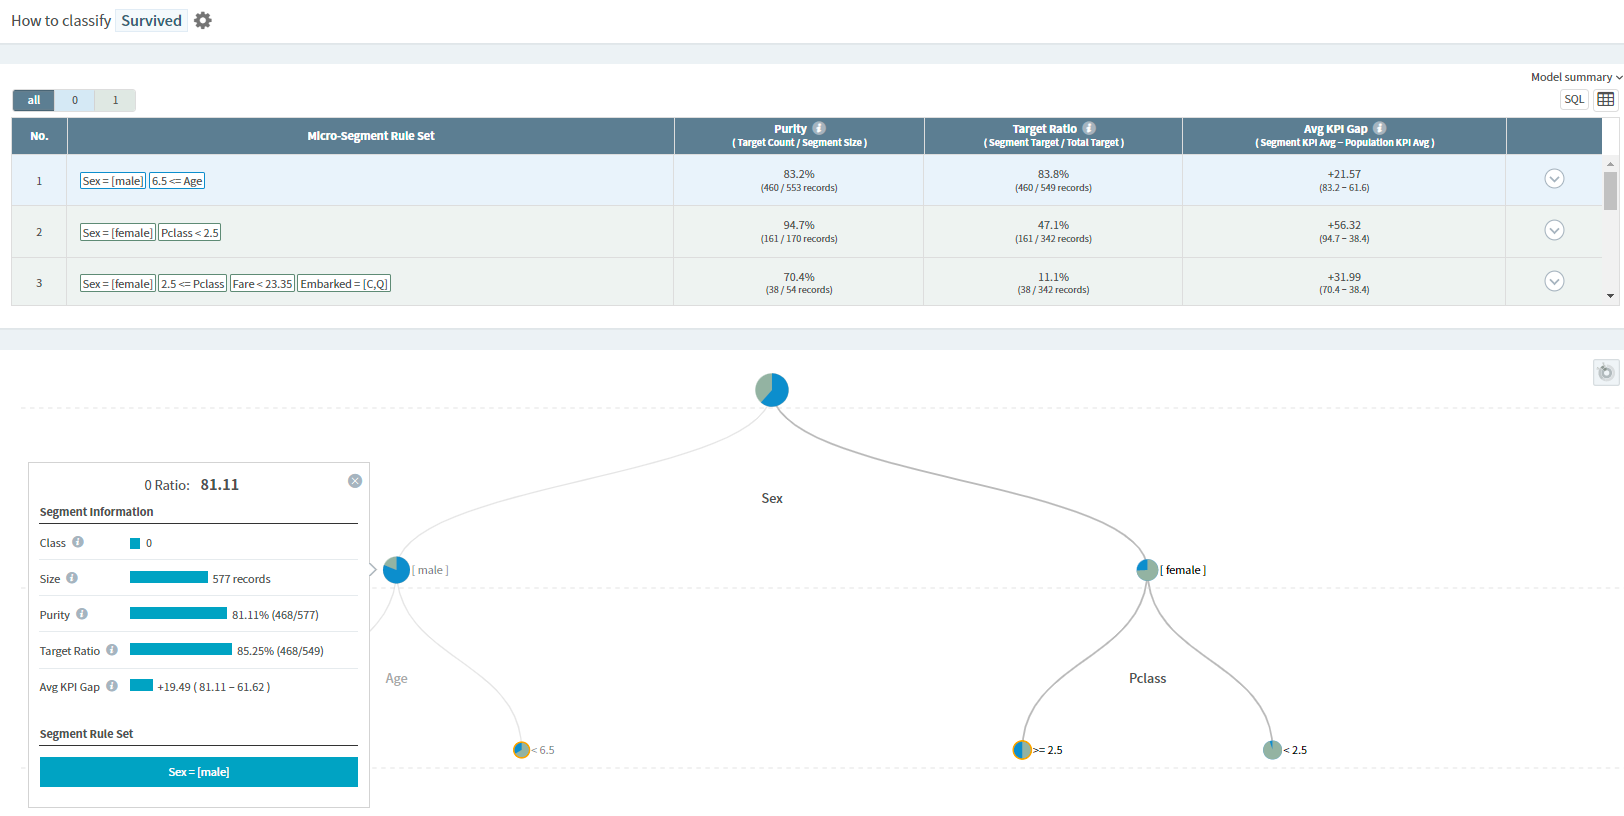
- On the other hand, we can see that the survival rate for being male was 66.6% for ages 6 and under.
From our EDA, we could see that gender and class have played a role in a passenger's survival. This information can be useful in further analysis and modeling of the dataset. Use HEARTCOUNT to find out more insights of your data.