- Anyone looking to leverage data in their reports
- Those who want to create reports that inspire decision-makers and stimulate their curiosity
- Anyone tired of being caught off guard by additional questions from decision-makers
Introduction: The Concept of Derrida's Différance
Let's begin with the concept of différance introduced by French postmodern philosopher Jacques Derrida. Différance, a term coined by Derrida, combines the ideas of difference and deferral and offers a perspective on how we interpret the world through text.
Différance suggests that the meaning of a word (A) is defined by its difference from another word (B), and this meaning is inevitably deferred because word B's meaning also relies on its difference from yet another word (C).
Applying this to data analysis reports, the task is about generating facts, knowledge, and inspiration to improve our company’s key metrics. A report quantifies and interprets the differences (temporal, categorical) in metrics. Knowledge starts from understanding these differences, which are relative and thus, their interpretation is continually deferred with the addition of new comparative elements.
If this resonates with you, read on to explore the traditional approach to writing data analysis reports (the first method) and a new approach that embraces the concept of deferred meaning (the second method).
Method 1: Delivering Self-Contained Insights Without Deferred Meaning
A common feature of various data analysis reports is that they conclude with "Insights." However, actionable insights in response to open-ended questions (why? how?) often fail to resonate with decision-makers, rarely driving behavior change.
Changing beliefs and behavior based on findings and opinions discovered by someone else is inherently difficult.
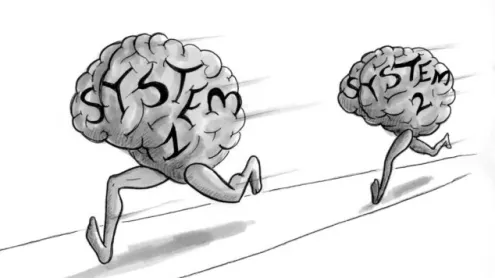
System 1 vs. System 2 Thinking
The goal in improving organizational decision-making, especially using data, is often said to be about enhancing System 2's (rational thinking) role to overcome System 1's (experience and intuition, heuristics) impulsive nature. The prevailing notion is that organizations should rely more on insights derived from data rather than intuition, and that all members should become proficient in using data for rational reasoning to realize the value of data.
However, I find this notion unrealistic. I believe that this misguided belief is a source of frustration for data practitioners.
Daniel Kahneman's core argument is that we cannot escape the unconscious influence of System 1. Expecting every organizational decision to be logical and analytical underestimates the power of System 1. Regardless of how sophisticated the data tools or how valuable the "Insights" in a report, most decisions will still be driven by System 1.
Method 2: Inspiring Decision-Makers by Embracing Deferred Meaning
Once decision-makers have established their baseline mental model of how the world works, a single data analysis report is unlikely to change their thinking and behavior.
There is an alternative way to write and present data reports: working with System 1 instead of fighting it.
Viewing data as text, the problem is that data cannot be fully explained without bringing in external context. Data provides fragments of answers but cannot explain the world by itself.
If data interpretation is limited by its inherent constraints and must be understood within the context of the decision-maker's mental model, the report writer should open pathways for the decision-maker to interpret the data independently, rather than drawing premature conclusions.
Living Data Reports vs. Static Data Reports
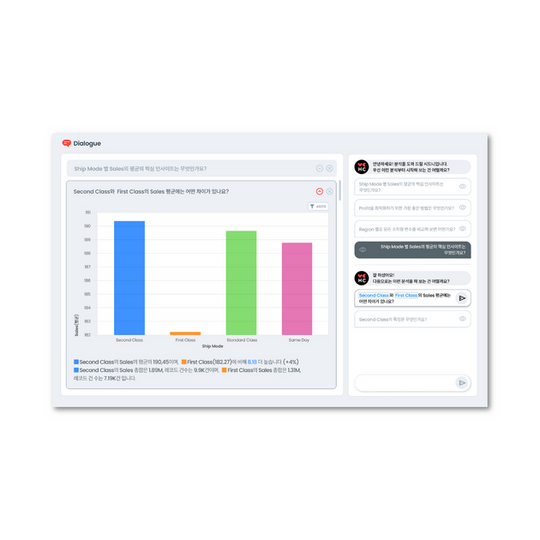
To inspire decision-makers and prompt them to question their mental models, we need tools that allow us to respond instantly to ad-hoc questions. Instead of static charts that present isolated facts, we need dynamic tools that can provide immediate answers to additional questions.
The experience of answering a specific question with data (e.g., the difference in sales between this month and last month) and then addressing follow-up questions (e.g., differences by product) mirrors Derrida’s concept of différance, where meaning is continuously deferred by introducing new elements (categories).
In the following practice section, I will demonstrate how to achieve this using EDA and Dialogue tools, along with HEARTCOUNT’s augmented analytics features to uncover valuable patterns and respond to ad-hoc questions instantly.
Preparation for Practice
Before we start the practice session, let’s briefly discuss the concept of the Exploration-Exploitation Dilemma and HEARTCOUNT’s approach to data report generation.
Exploration vs. Exploitation
The "Exploration-Exploitation Dilemma" involves finding a balance between 'exploitation' of known knowledge and trying new, unknown options, 'exploration'. For example, when choosing a restaurant, it’s like deciding between revisiting a familiar favorite (exploitation) and trying a new place (exploration). Striking the optimal balance between these two strategies is crucial in many decision-making scenarios aimed at maximizing long-term rewards.
In data reporting, balancing the 'exploitation' approach, which presents reports from familiar perspectives (such as sales differences by product category), with the 'exploration' approach, which seeks to uncover new insights from novel perspectives (such as sales differences by product category and time of day), is crucial.
Exploratory Data Analysis (EDA), traditionally seen as the domain of practitioners, should also be accessible to decision-makers. For our organization to maximize long-term rewards, it is the decision-makers who need to update their mental models.
Decision-makers must experience the dopamine rush and the formation of new neural connections in their brains that come from exploring and discovering insights in the data. This shift is essential to transform data-driven decision-making from a mere slogan into a profitable practice.
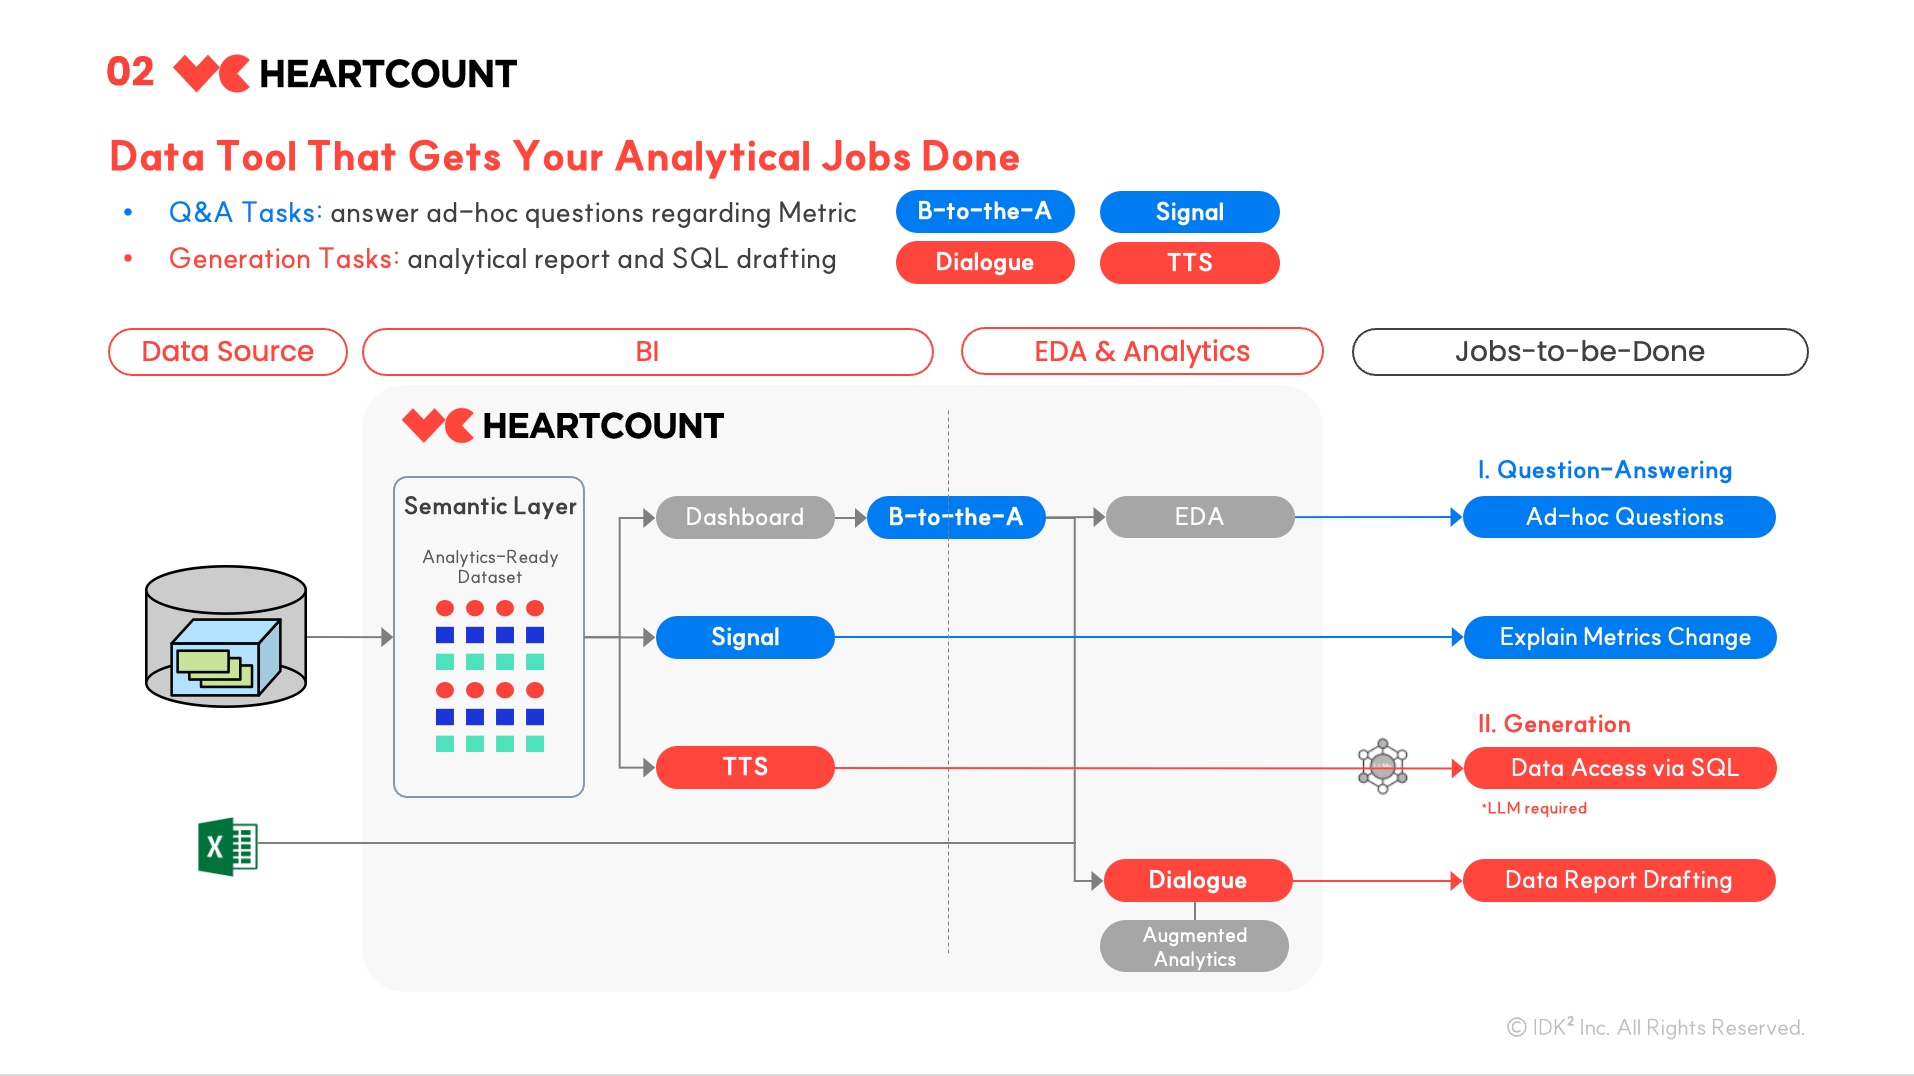
Data Analysis Report Generation in HEARTCOUNT
Data tasks can be divided into report generation and question-answering. HEARTCOUNT's approach to these tasks is outlined below. For more details on the report generation feature, Dialogue, see the linked guide.
Practice: Writing Data Reports
In the following practice, we will use Excel for EDA (Exploratory Data Analysis) and Dialogue to quantitatively explore several hypotheses. We will leverage Augmented Analytics to verify the relative usefulness of patterns discovered through these hypotheses and identify unexpected patterns (unknown unknowns). Additionally, I will demonstrate how to create a report that can instantly answer ad-hoc questions.
- Dataset: HEARTCOUNT Sample Dataset > Insurance Dataset > sample insurance
- Report Writing Tool: Notion (or any text editor)
- Analysis Tool: HEARTCOUNT (Upgrade to free-trial to use bookmark feature)
Following this guide, let's create reports answering these three questions:
- Understanding key factors driving medical insurance claims
- Analyzing characteristics of customers who file claims versus those who do not
- Identifying customer segments with low probabilities of filing claims
Conclusion: From "Actionable Insights" to "Knowledge Production"
Many believe that the role of data or data analysts is to provide actionable insights to help people make better decisions. However, "Actionable Insight" often reminds me of the protagonist from the movie Oldboy, who just gets by addressing today's questions.
To surpass merely addressing today's questions, data must contribute to transforming the decision-maker's mental model. Instead of fighting System 1, we need to work with it. Rather than rejecting biased thinking, we need to continuously update biases with refined information.
Reports that recommend "specific" actions based on "specific" patterns fail to change System 1 because such findings are dismissed as coincidental rather than new knowledge and theory. Knowledge and theory have the power to make us see the world differently. They make us pause and reflect, unlike fragmented facts and insights, which System 1 ignores.
Delivering new knowledge and theory instead of "actionable insights" won't be achieved solely by creating data reports that can instantly answer additional questions. However, if our data reports can generate new knowledge and theory, changing the decision-makers’ System 1, the impact will be profound. This is a crucial challenge we must continue to tackle to establish data analysis as a valuable organizational function.
Log in with your Google account and start using it now.