Time-Series Analysis
Time-series analysis refers to the process of extracting meaningful information from data stored in chronological order at regular intervals. This analysis is used to understand past behaviors and predict future actions.
Despite its importance in data analysis, its practical use has been very limited due to technical barriers in the theory and application of its analysis methods and various limitations associated with predicting the future.
However, considering the increasing availability of time-series data for business decision-making and the unique insights provided only by time-series analysis, it is essential for more businesses to utilize time-series data more frequently.
In the article and video lecture below:
- Video Lecture: We explain the main concepts of traditional time-series data analysis, focusing on the AR (AutoRegressive) model, and also touch lightly on time-series analysis using the latest machine learning techniques.
- Blog Post: We will conduct a hands-on exercise to identify seasonal and cyclical patterns that affect sales using actual time-series data.

What is Time-Series Data?
Time-series data refers to data observed and collected at regular time intervals. Thus, time-series data contains a "time variable" indicating the date or time when each record was collected.
For instance, time variables like "2022-10-01" or "2019-02-07 08:55:16" can be considered structured numerical variables with a specific format (e.g., year-month-day). However, to identify cyclical patterns based on weekdays or weekends or time slots, one might derive variables like month or weekday from the time variable. In this case, the time variable takes on categorical characteristics.
Goals of Time-Series Analysis
From an Exploratory Data Analysis (EDA) perspective, the primary objectives of analyzing time-series data are:
- Trend: Understanding the tendency of key indicators to rise or fall over time.
- Cyclic Pattern: Identifying patterns that recur at specific intervals, such as hourly, daily, monthly, or seasonally.
HEARTCOUNT Hands-on Session: Time-Series Data
Let's examine the sales data over time to understand the sales trend and identify any periodic patterns that influence sales.
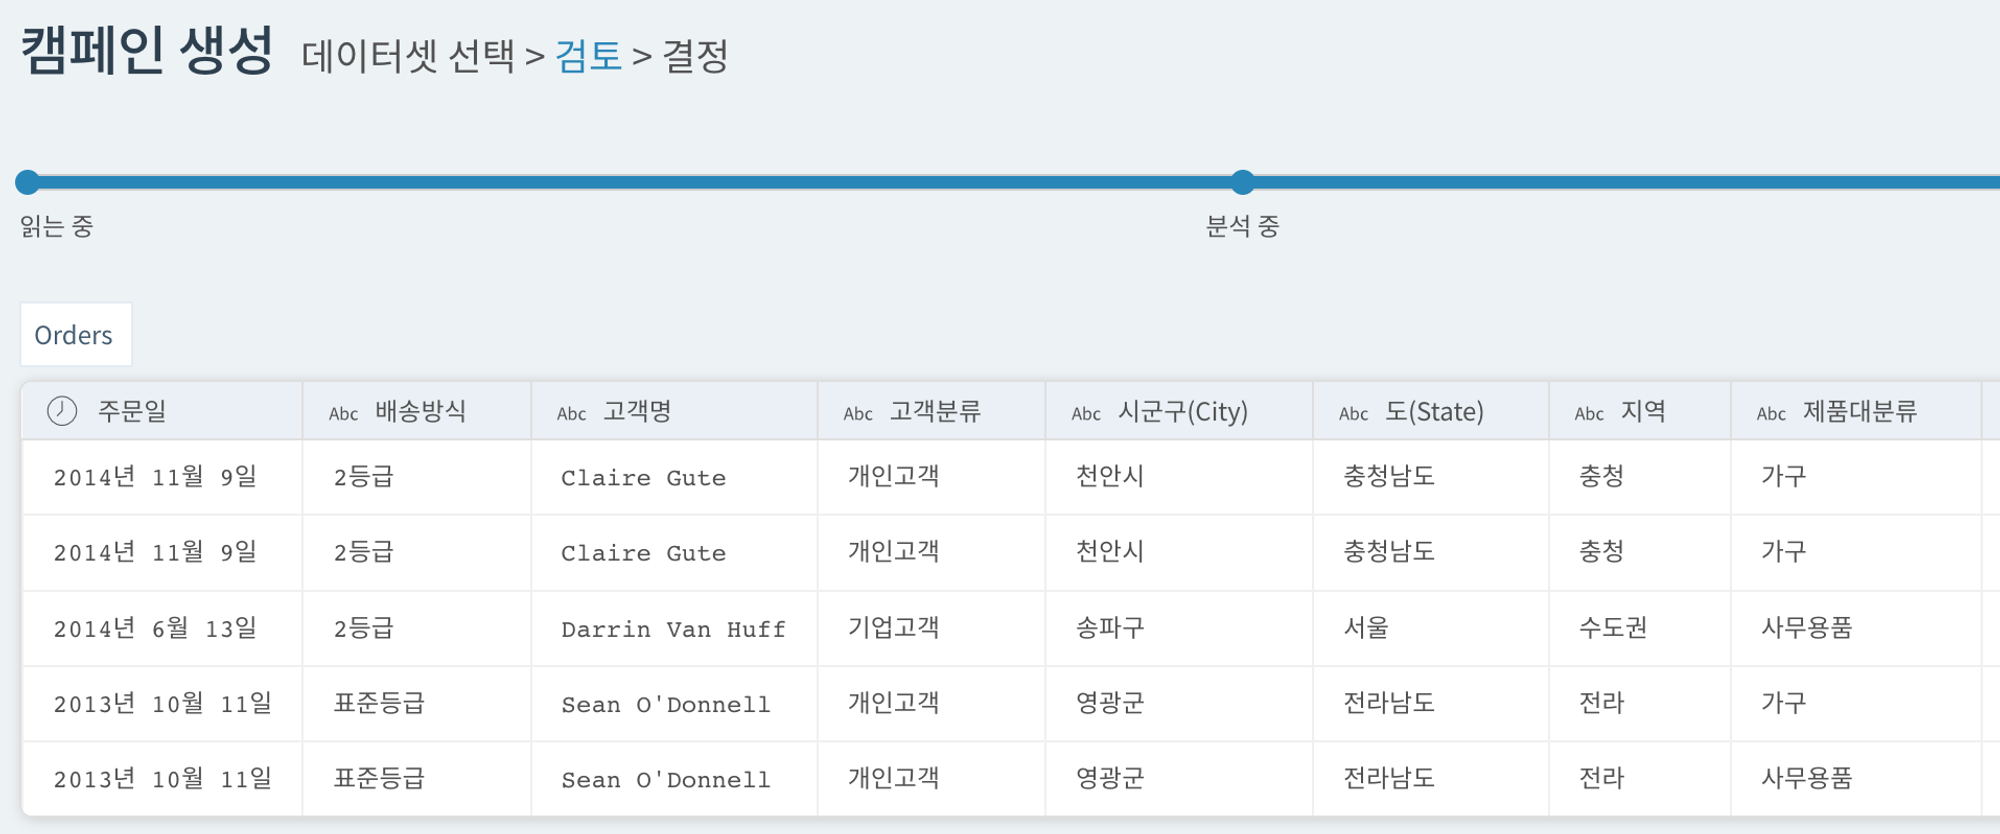
Initially, you can confirm the existence of a "Order Date" time variable (e.g., 2014-11-09) in the dataset.
Reviewing Sales Trends Over Time
Let's use the Smart Plot menu to explore the changes in sales over time.
- Choose the "Order Date" for the X-axis and change the aggregation method for sales from average to total (sum).
- Click on the clock icon next to the order date and adjust the time granularity (time grain) to year, quarter, month, week, etc. It seems that choosing a monthly time granularity provides a clear view of the data.
- By selecting the "Product Category" as a sub-group and changing the chart type to stacked area, we can see the monthly sales aggregated by product category.
However, what message does the above chart convey?
While it's evident that sales varied by product category each month, such an observation is trivial and doesn't provide significant insights.
Identifying Seasonal/Cyclic Sales Patterns
- Let's choose the derived time variable "Order Date - Monthly Cycle" for the X-axis (these derived time variables in HEARTCOUNT are designed to help identify cyclic patterns).
- To compare across years, select "Order Date - Year" for the split-screen condition.
- It might be more appropriate to change the chart type from stacked-area to stacked-bar for a better comparison of specific monthly sales figures.
- Let's also explore the sales patterns for different product categories by selecting them one by one.
- As a bonus, selecting the "Weekday Cycle" instead of the "Monthly Cycle" for the X-axis will show the sales variation across different weekdays.
Time, although beyond our direct control, is a crucial dimension for understanding our world and our data. Deep diving into data to identify the reasons for changes in key indicators compared to previous periods is a significant aspect of EDA.
Remember, the time variable can be used as a numerical variable that flows in one direction, or it can be utilized as an ordered categorical variable by deriving features like month or weekday.
Related Content
Discover more of HEARTCOUNT's educational content: