You can download the presentation material from the section below.
Introduction - The Trajectory of HEARTCOUNT
HEARTCOUNT has been in the market for eight years, likened to a 50-year-old in pet years, suggesting it's mature enough to comprehend its purpose. The product's evolution is divided into three stages:
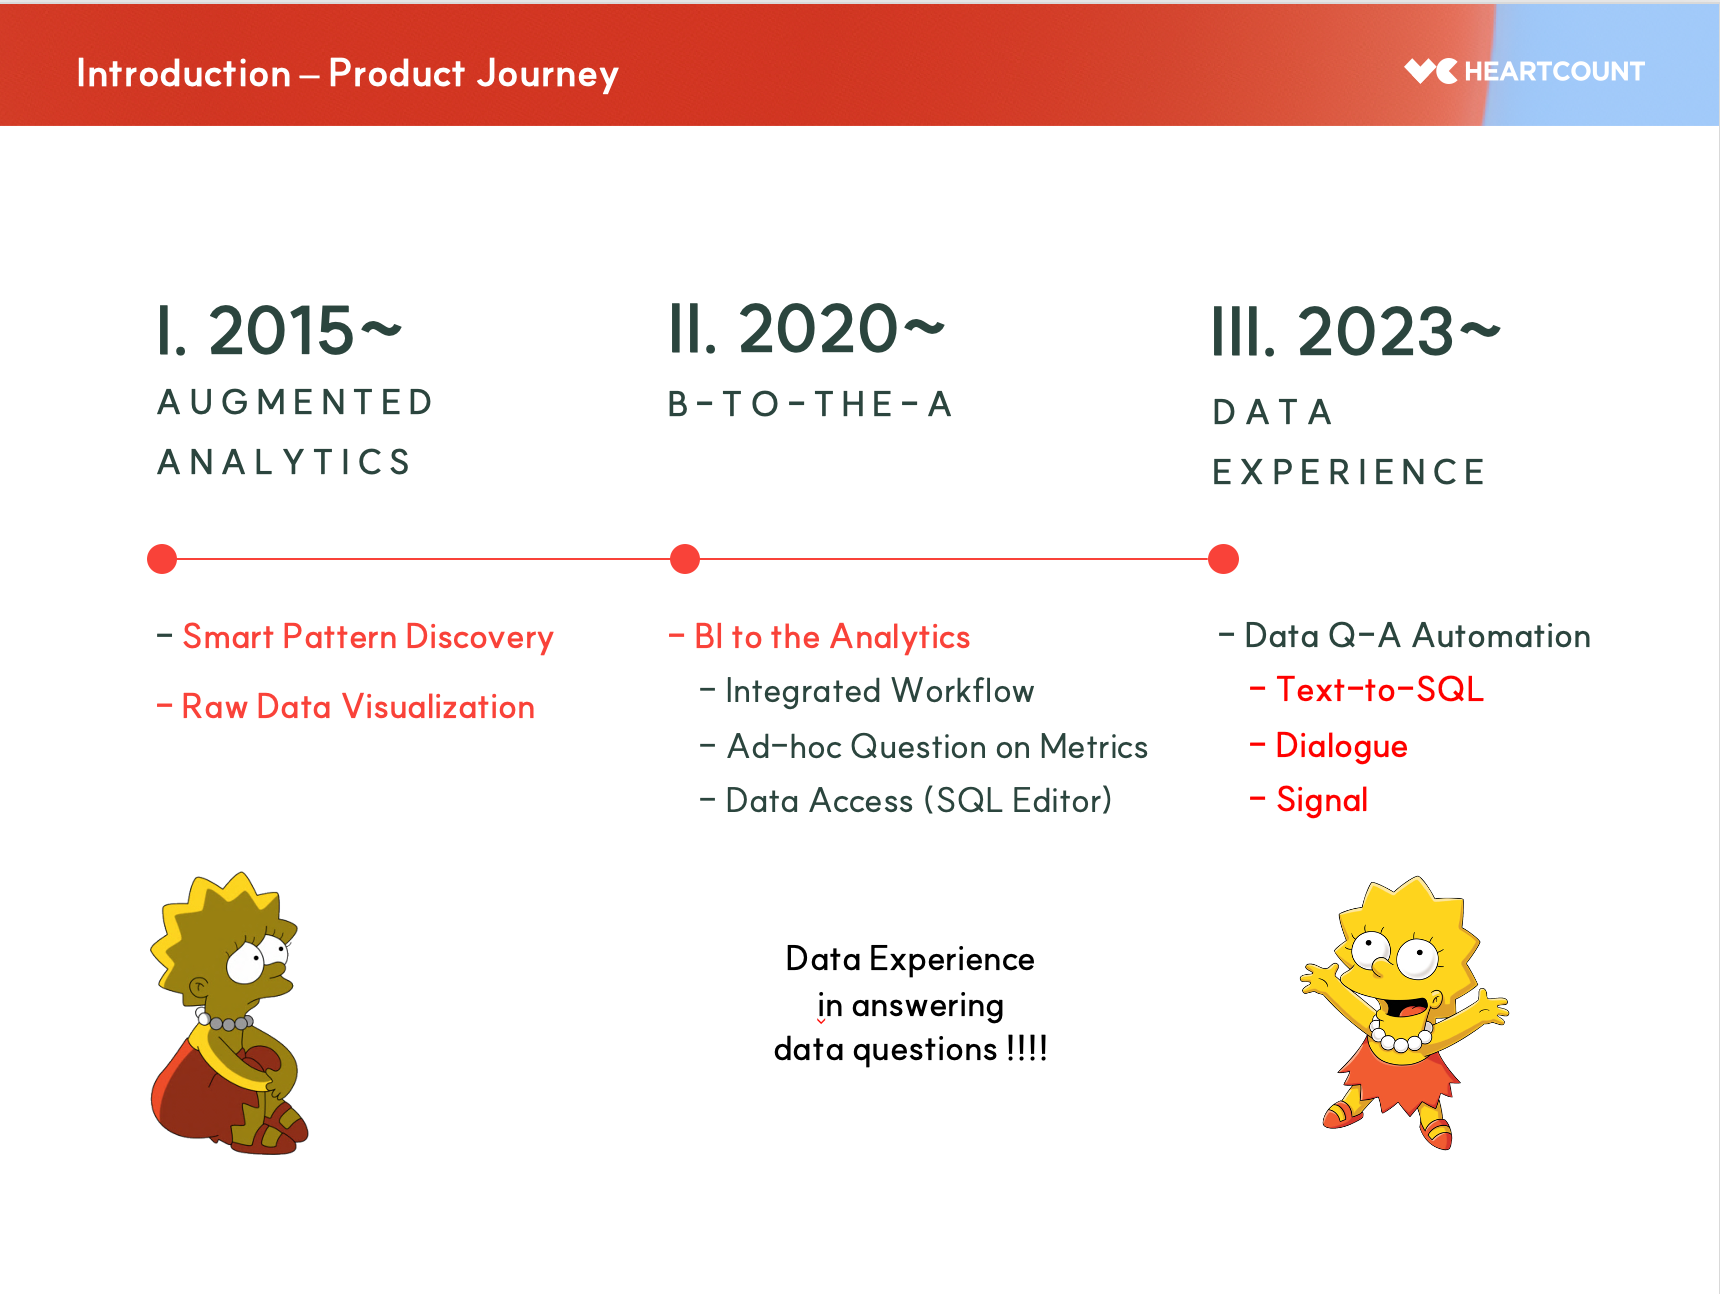
HEARTCOUNT 1st Generation - Augmented Analytics
Initially, HEARTCOUNT's core functionality centered on automatically identifying patterns in data, empowering professionals to use data proactively.
- Interactive Data Visualization: Instead of aggregating data into charts like Tableau or PowerBI, this method visualizes over a million individual records in an interactive format. This allows for a detailed, visual understanding of the micro-order and structure inherent in the data.
- Comprehensive Analysis Without Hypotheses: The system analyzes every possible scenario without starting hypotheses and provides statistically significant results in natural language. This ensures that practitioners can thoroughly comprehend the patterns within the data without missing any crucial details.
HEARTCOUNT 2nd Generation - B-to-the-A
This phase combined traditional BI (Business Intelligence) functionalities with analytics, enabling users to both monitor key performance indicators (KPIs) and explore detailed patterns within the same tool, named 'BI to the Analytics'.
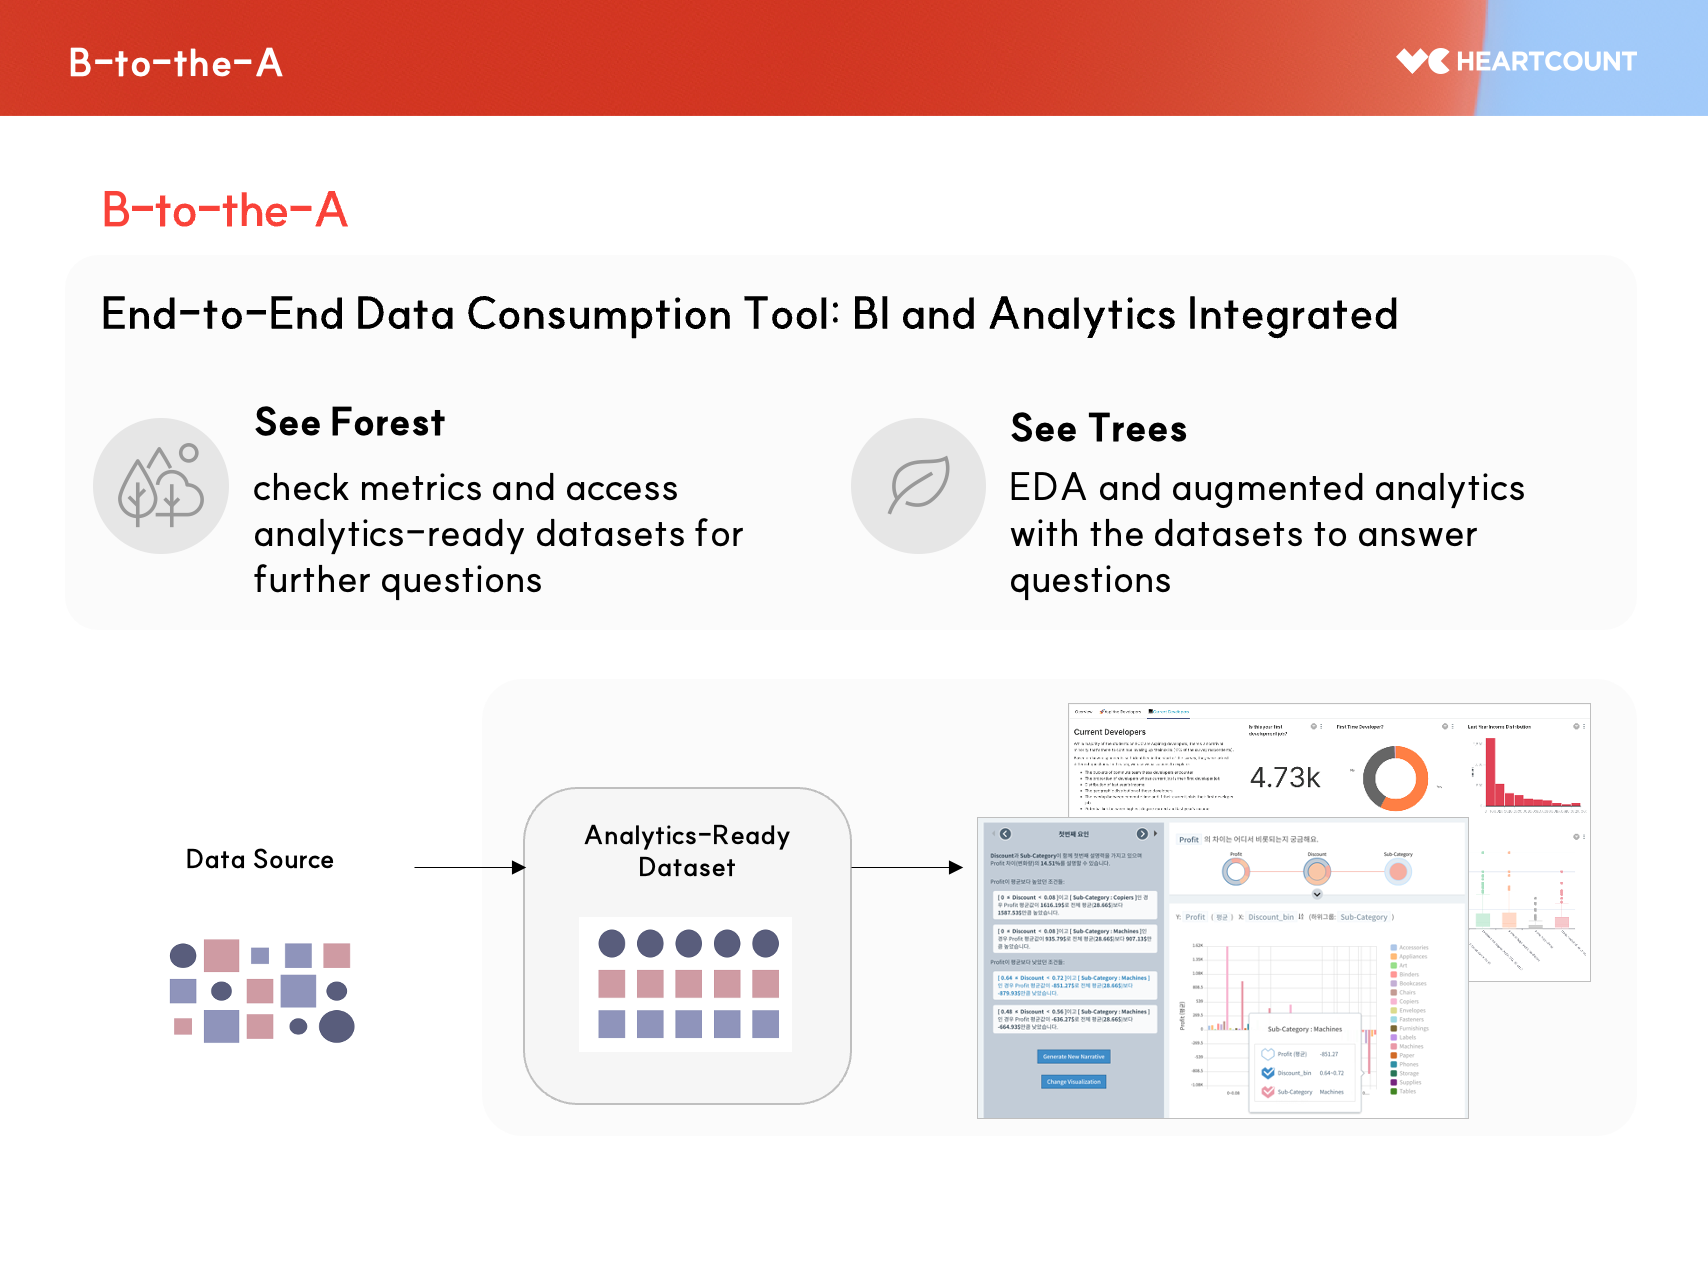
Like the video shown below, if additional questions arise while viewing the charts, you can immediately dive into Exploratory Data Analysis (EDA) and hypothesis testing with the relevant dataset without delay.
What's Next for Data Analytics?
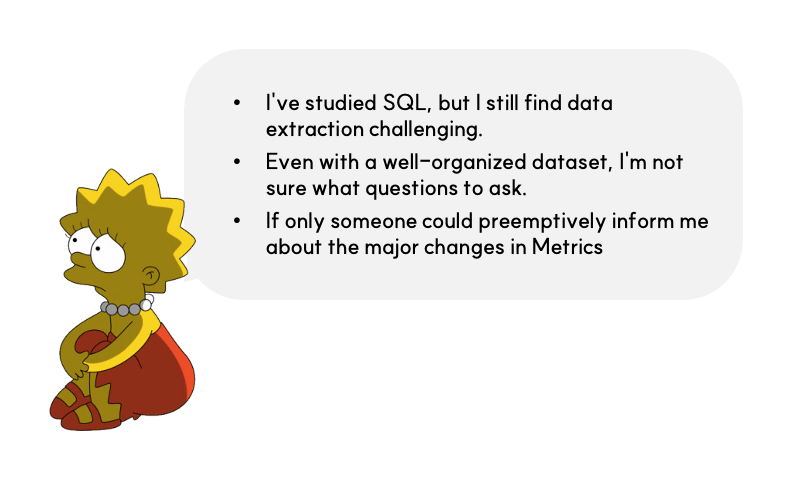
While the first two generations were successful, the aim was to further enhance the data experience for professionals by addressing specific challenges:
- Difficulty in accessing relevant data due to complex SQL requirements.
- Uncertainty about how to start analyzing well-organized data and what questions to ask.
- The desire to identify key indicator changes proactively, before being prompted by a superior.
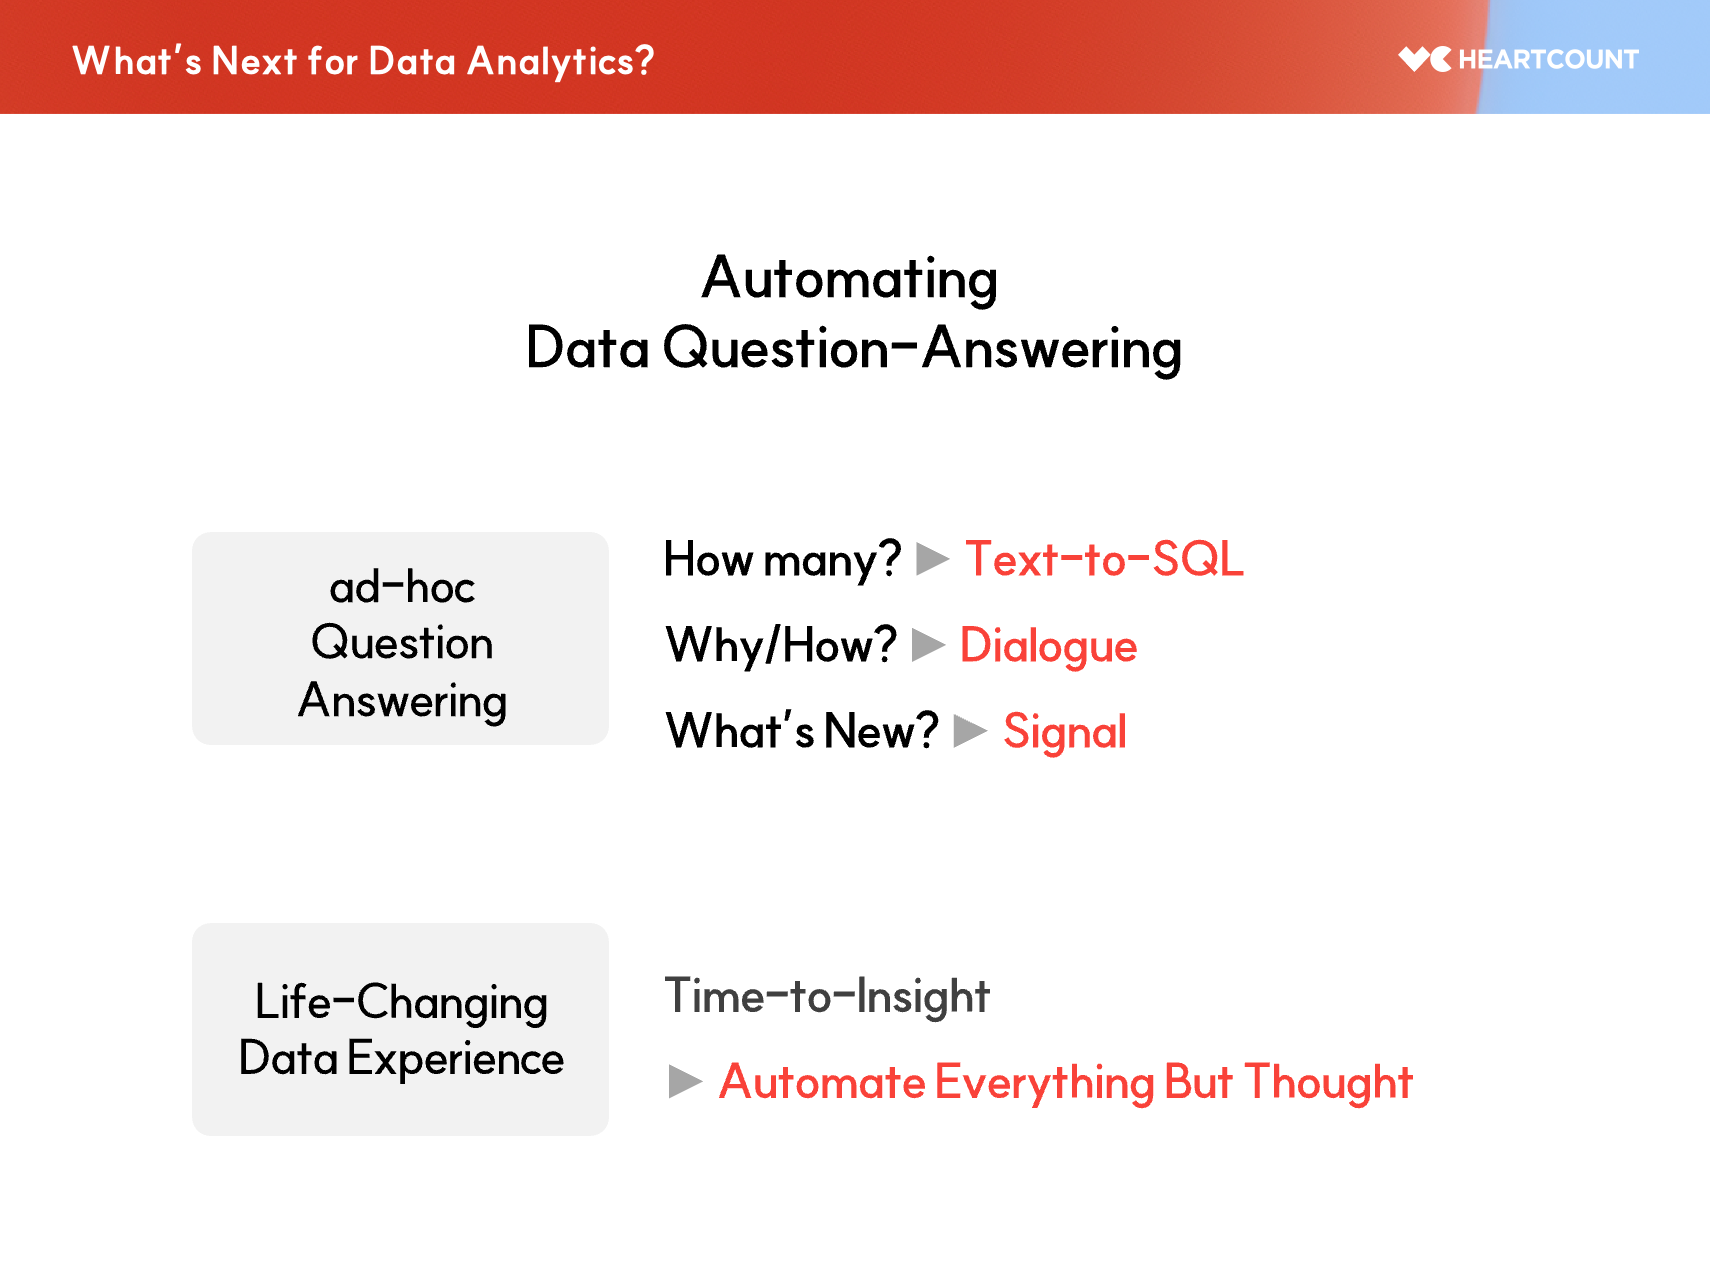
New Features 1 - Text-to-SQL
The first of three new technologies, Text-to-SQL, converts natural language into SQL queries, simplifying data extraction and enhancing user autonomy in data handling.
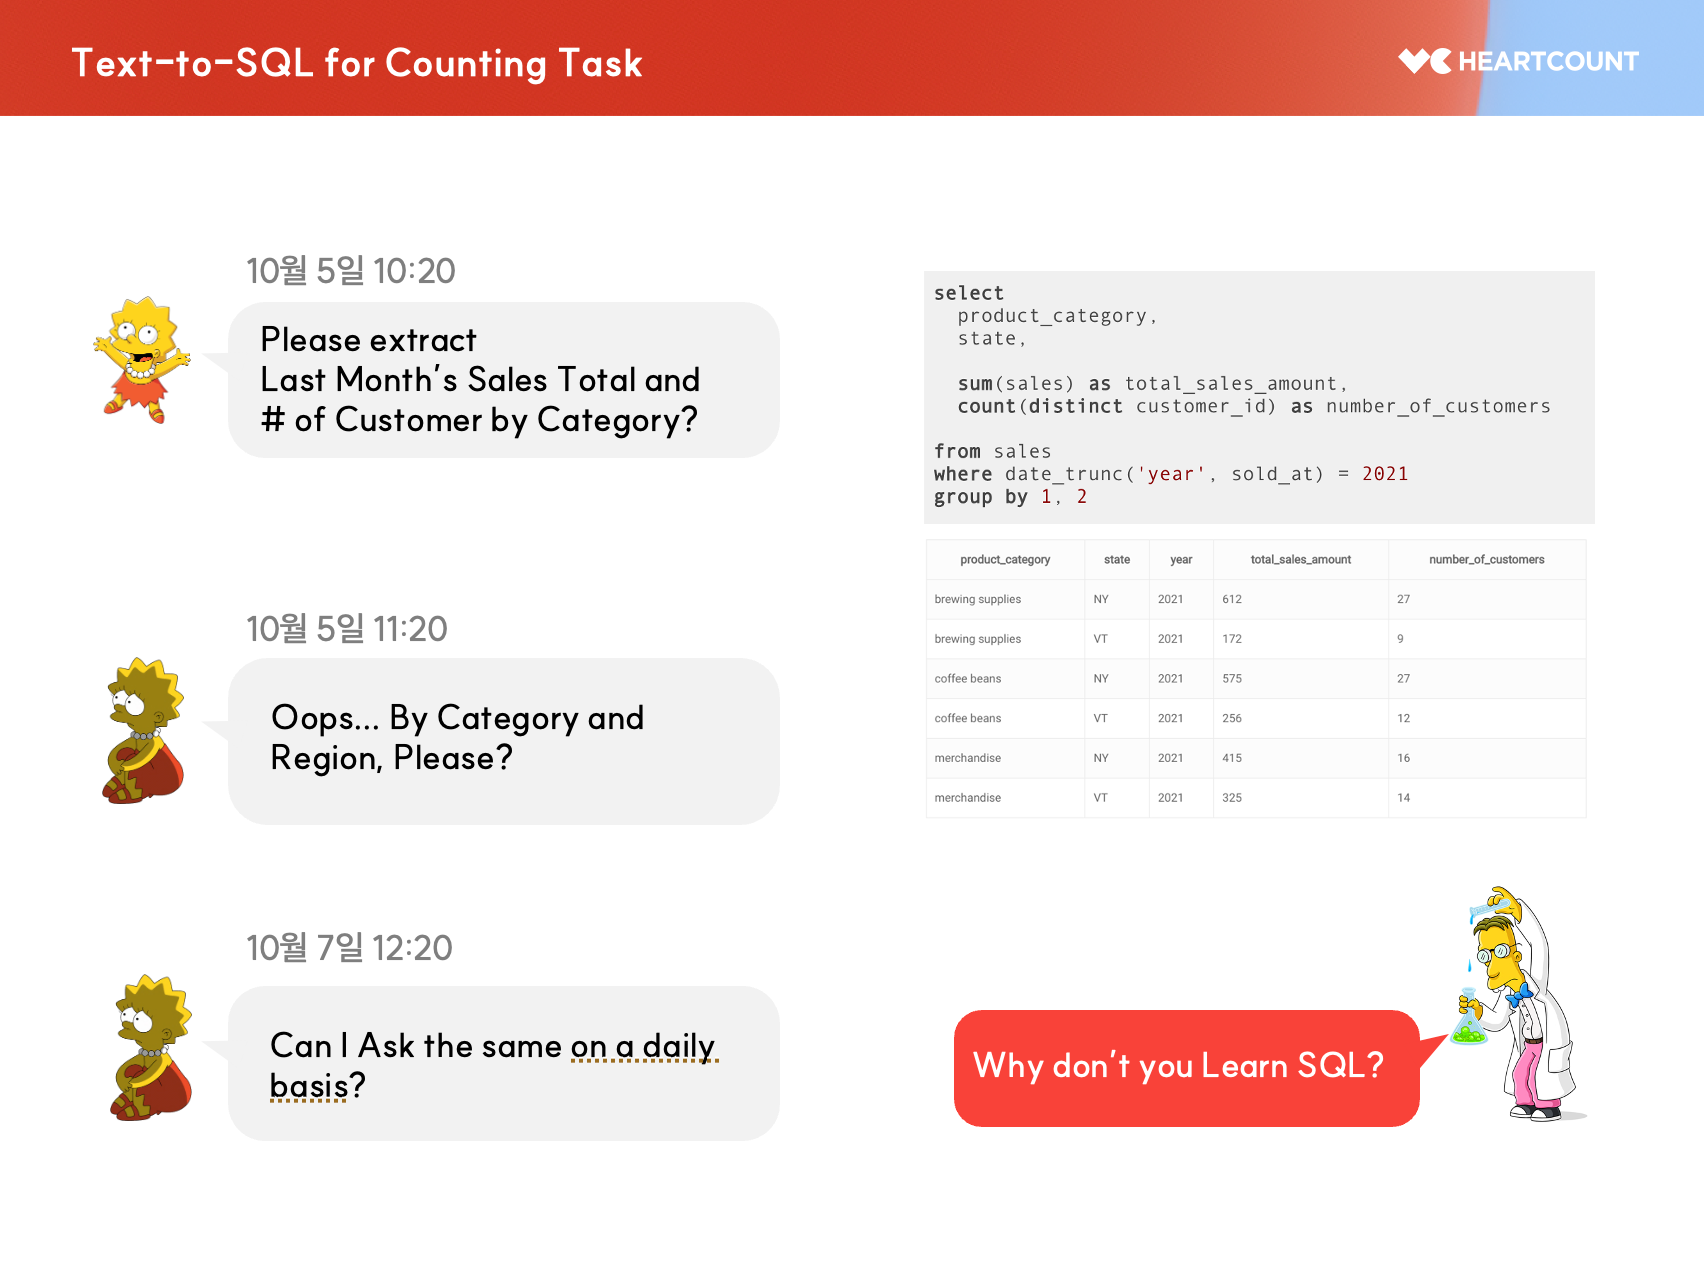
- SQL and Human Language Integration: As demonstrated in the video below, if the language of data extraction, SQL, can communicate effectively with human language, it would significantly solve many data access challenges faced by practitioners.
- Limitations: However, simply adopting this technology does not guarantee its effective functioning in all scenarios. It works best with databases that are not overly complex, where some basic preparatory work (like adding column information) is sufficient for effective use.
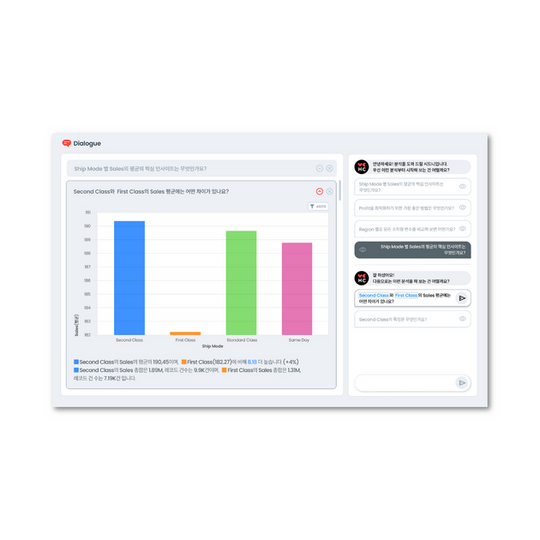
New Features 2 - Dialogue
Some questions cannot be resolved by data alone, especially those starting with 'why' or 'how'. These questions require analytical reasoning to derive sub-questions, which are then represented in charts (Question-to-Chart). The process involves repeatedly extracting quantitative facts from these charts (Chart-to-Narrative).
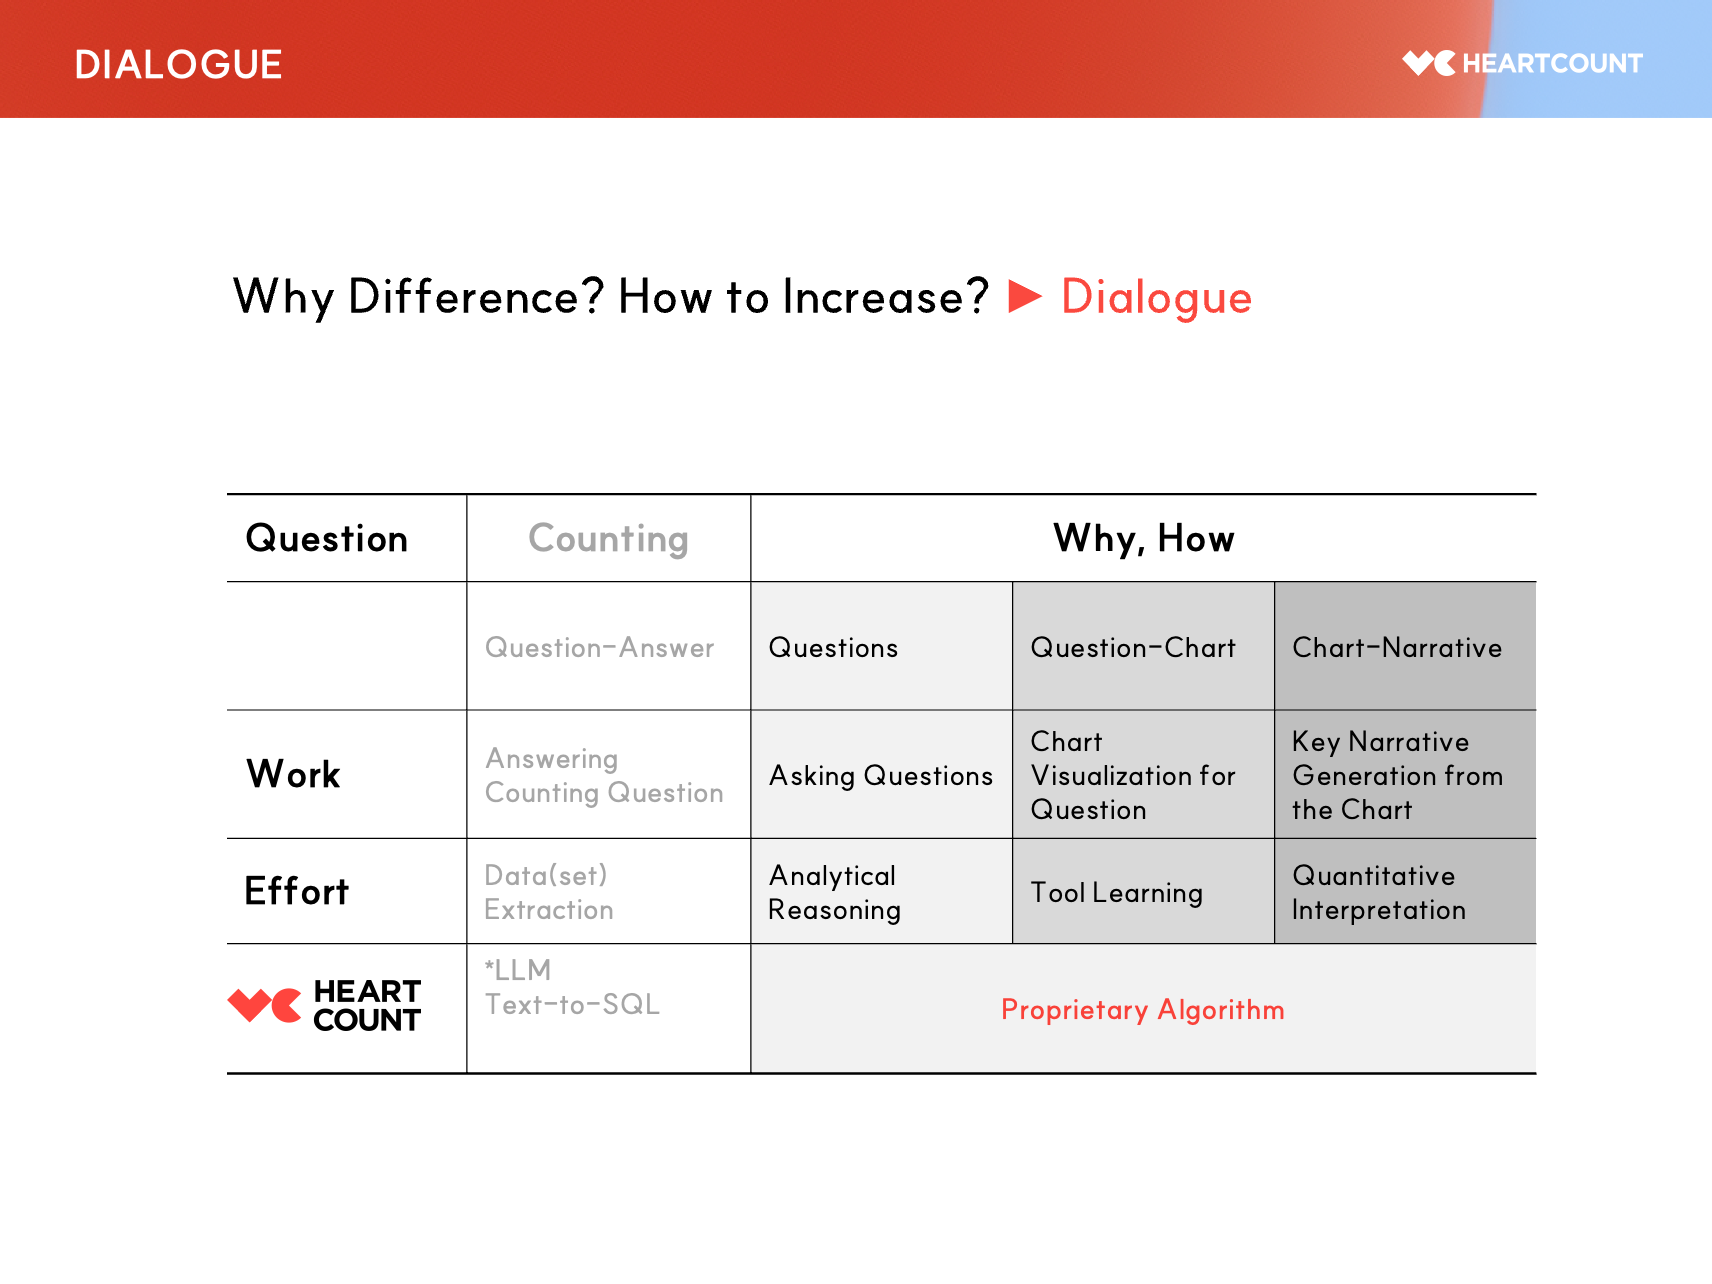
- Beyond Language Models: Instead of relying on probabilistic language models (LLMs) that can be right or wrong, HEARTCOUNT solves these tasks through its own model, aptly named 'Dialogue'.
- Socratic Method for Practitioners: The goal is to help practitioners form well-founded opinions and new perspectives, asking questions they might not have thought of and providing accurate and diverse facts and viewpoints, much like Socrates' method of dialogue.
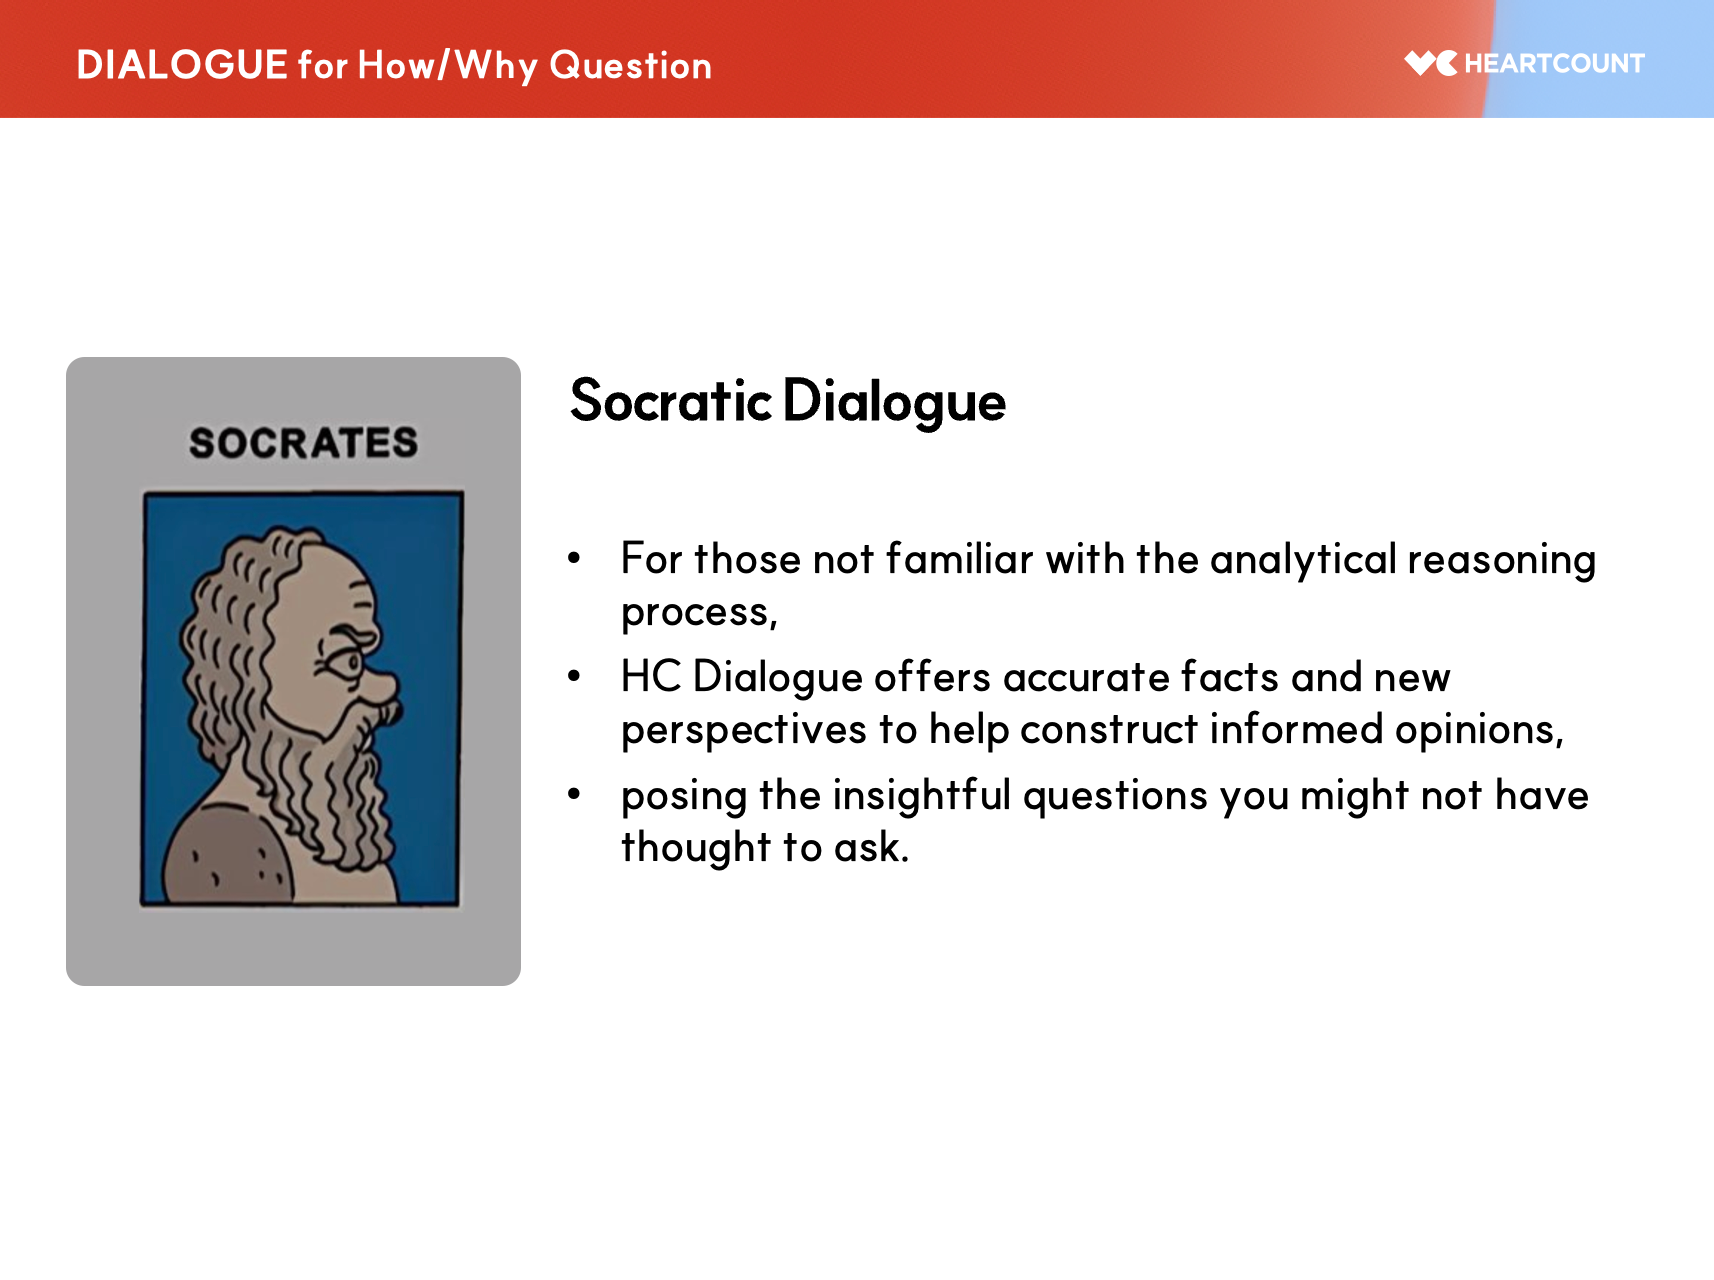
Just like this.
New Features 3 - Signal
The third innovation, Signal, is a feature set that automatically notifies users of significant deviations in KPIs and their main drivers, without requiring specific queries. It is divided into two sub-features.
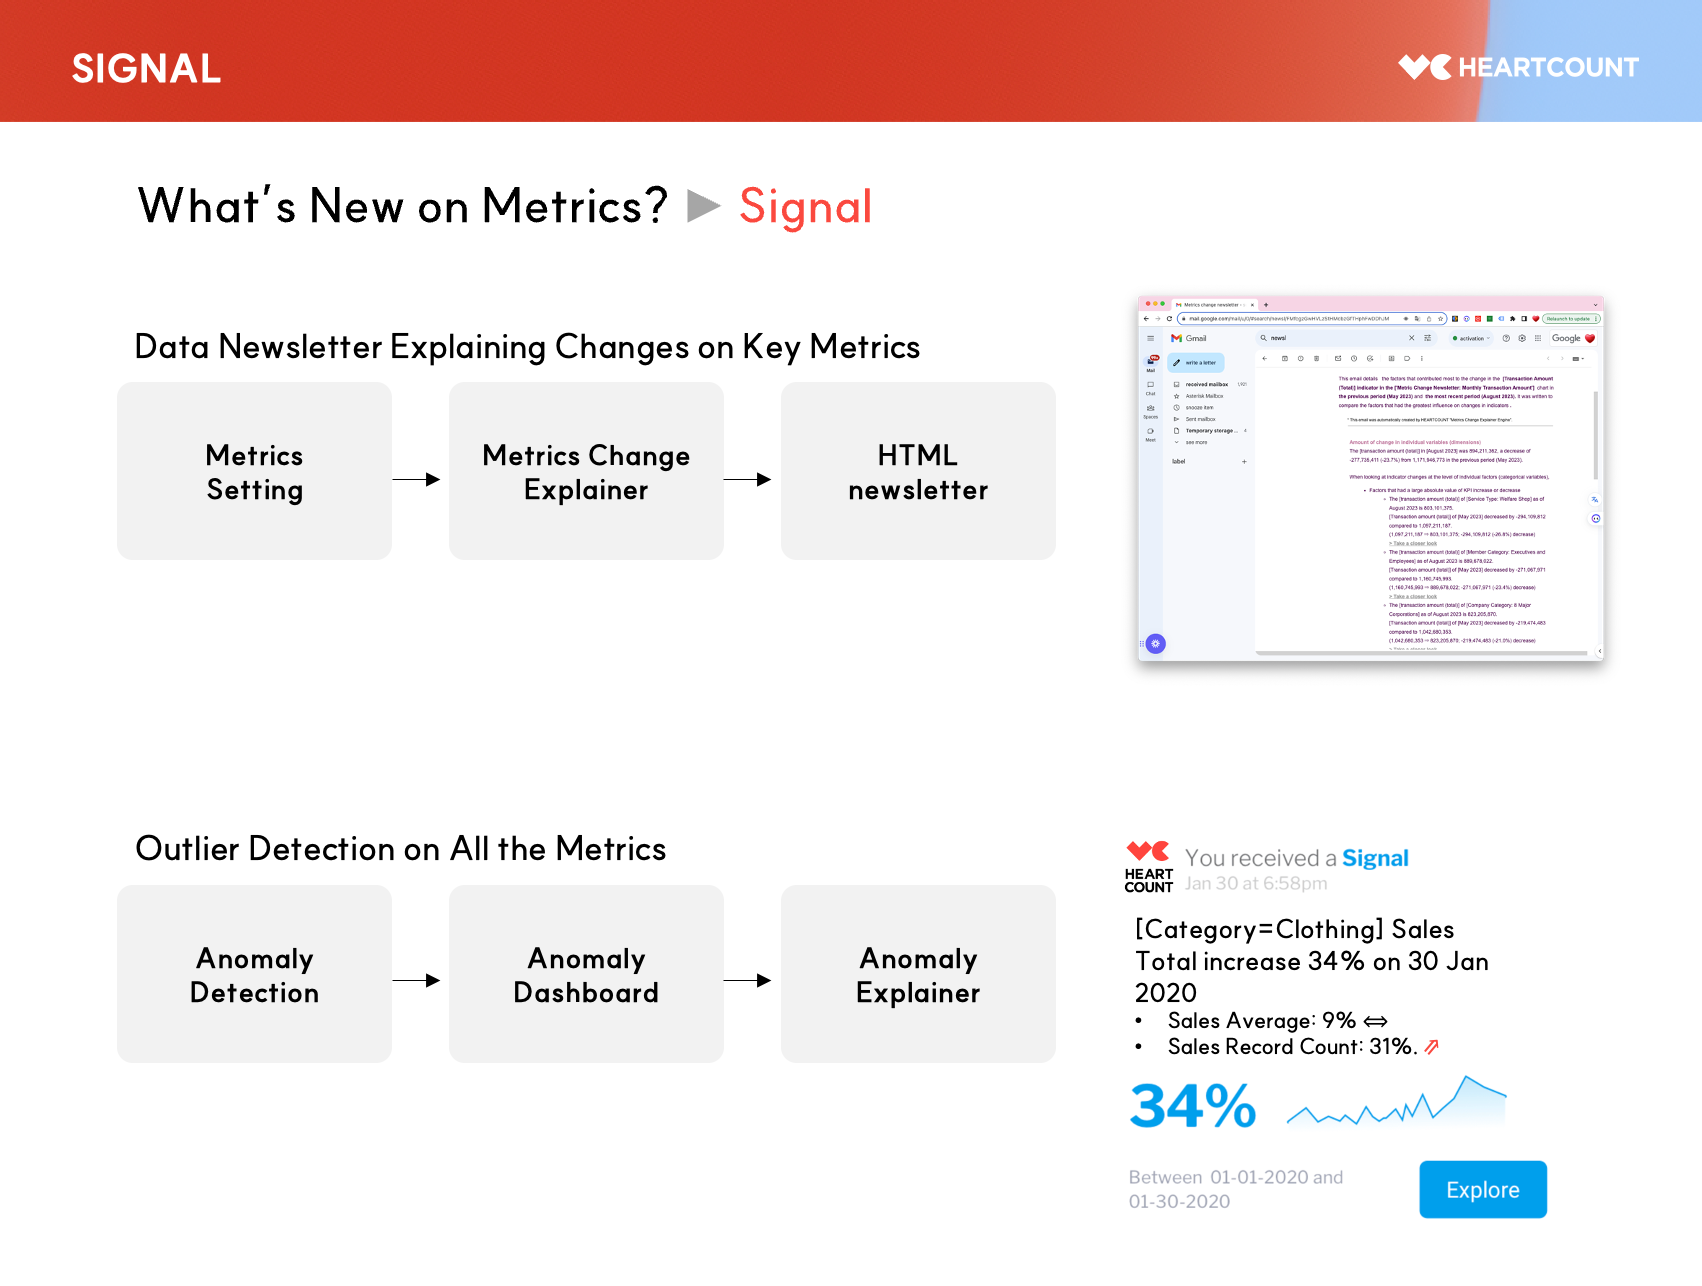
- Proactive Notifications: Signal proactively informs users of significant deviations in all KPIs/indicators registered on the HEARTCOUNT dashboard, considering seasonal patterns and trends, without needing specific queries. It's a highly useful feature, where users who try it tend to use it repeatedly.
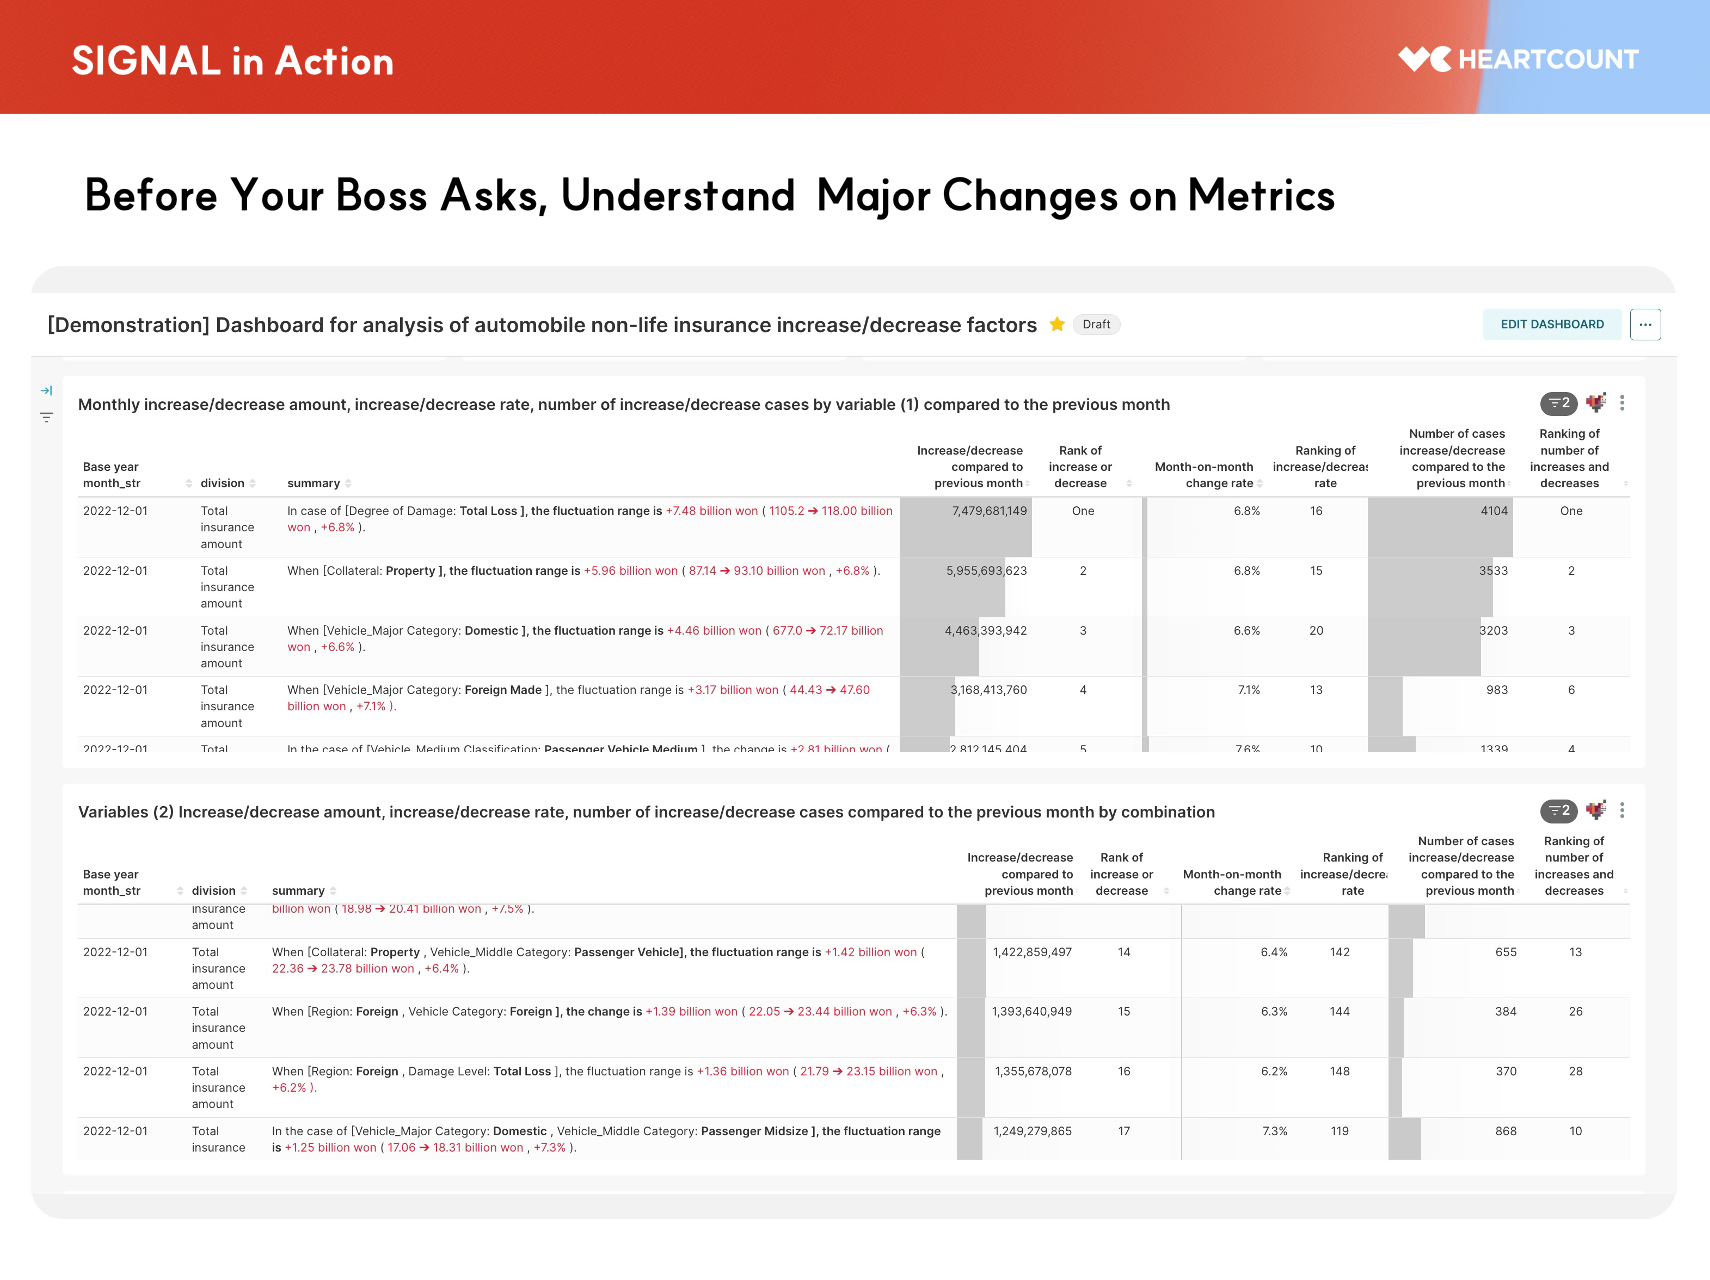
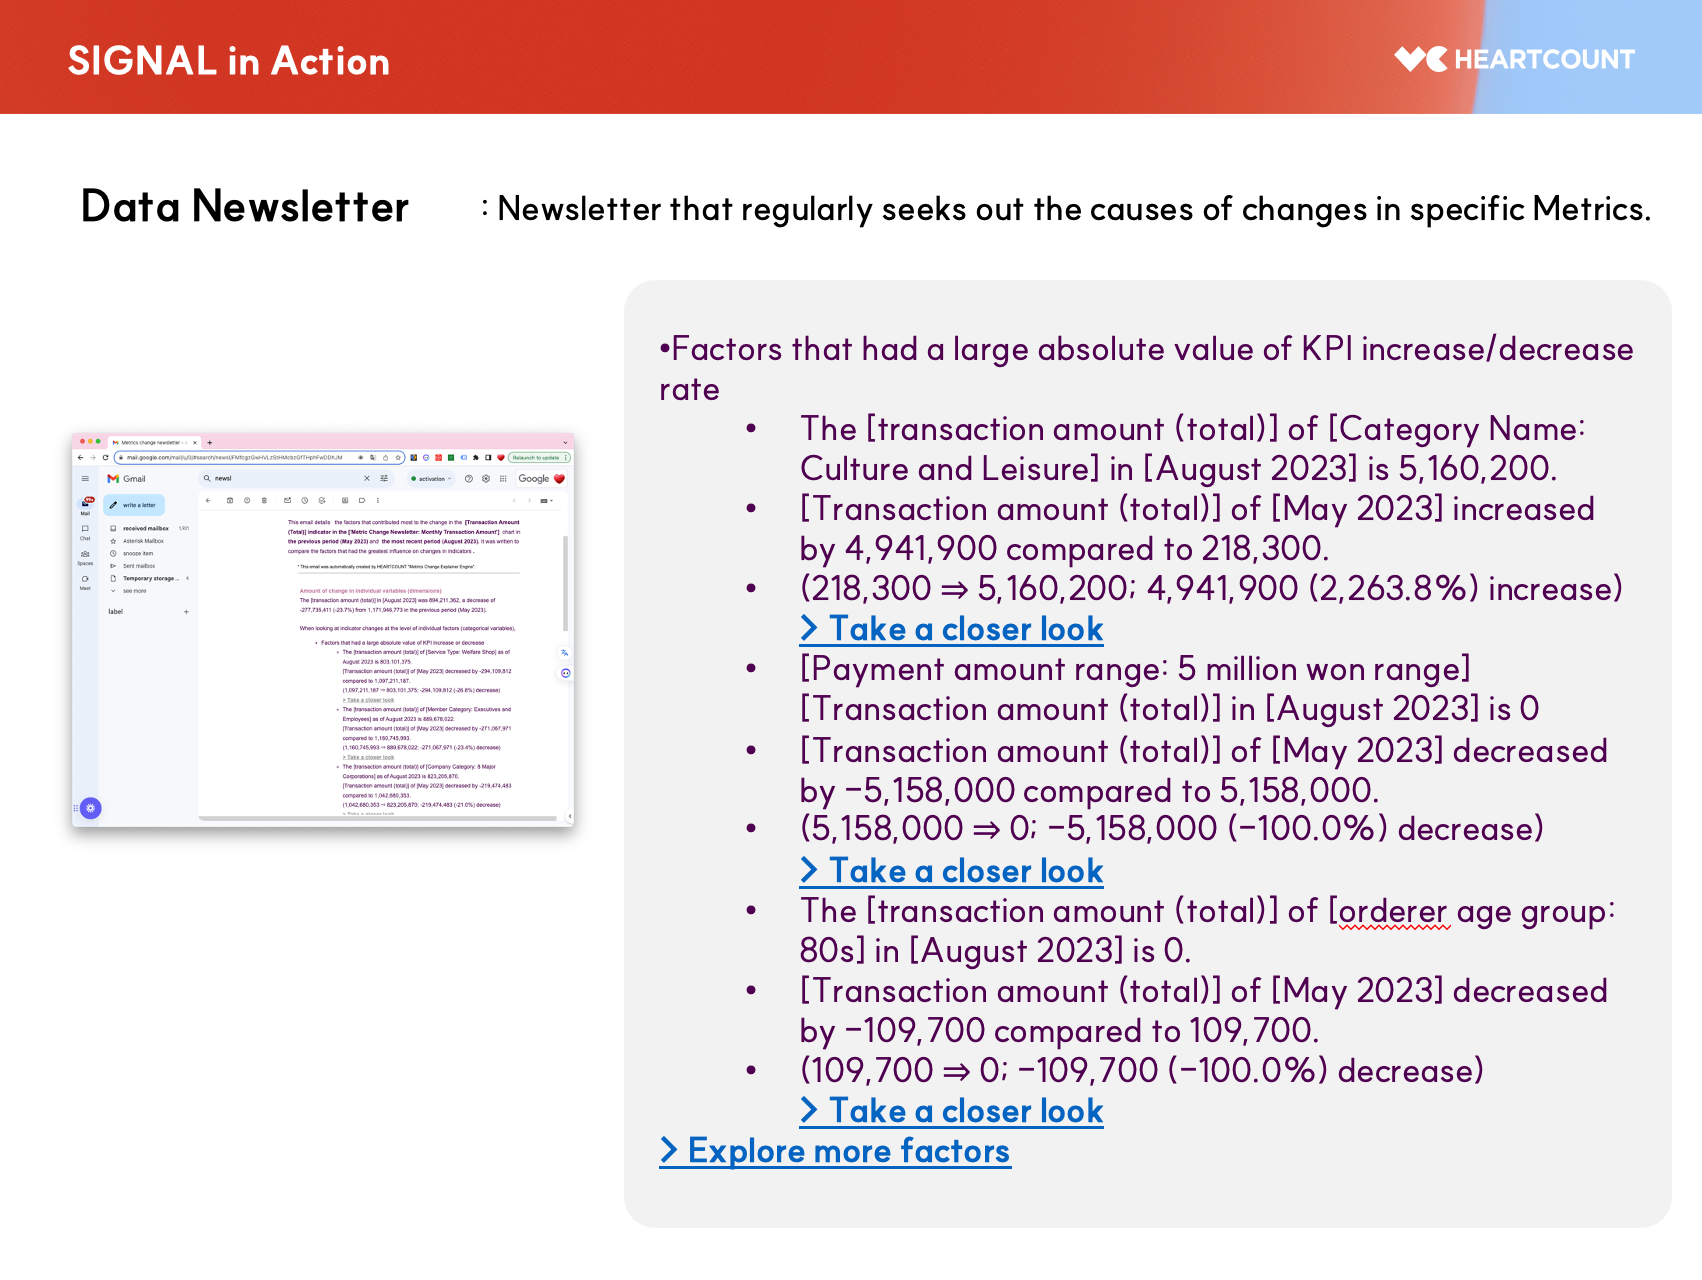
- Signal Data Newsletter: For some crucial indicators, it would be beneficial to receive regular updates on major change factors in the form of a newsletter. Signal does exactly this, providing important information on key indicators periodically.
For inquiries about the product, please contact support@idk2.co.kr.