Meet HEARTCOUNT Dialogue
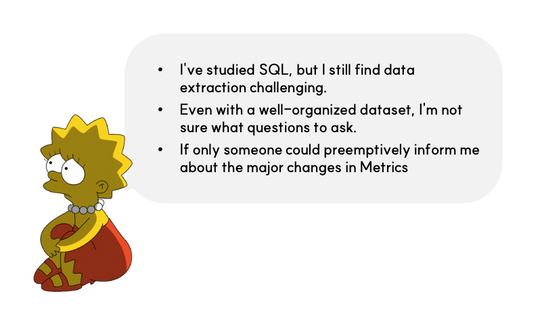
The saying "Big data is the oil of the 21st century" often feels hollow because most people lack the skills to refine raw data into valuable insights (like turning crude oil into usable petroleum). The reality is that learning data analysis and applying it to one's business is not straightforward. Even after spending hundreds of hours or years learning, many professionals still find the world of data analysis perplexing.
Exploratory Data Analysis (EDA) is a starting point in data analytics. EDA, unlike traditional statistical analysis which tests hypotheses, involves exploring all possibilities without knowing beforehand what might be important. The challenge lies in not knowing where to start, and many professionals, despite having vague business-related questions (e.g., "Why did this month's sales drop?"), lack the analytical reasoning to draw insights, often only managing to create basic visualizations.
The Importance of Asking the Right Questions

Drawing from Socrates' method, the importance of asking the right questions and how it leads to knowledge production is emphasized. In EDA, instead of simply providing tools for creating visualizations, it's more beneficial to expand individuals' analytical capabilities and thinking, to help them independently navigate through their questions and insights.
HEARTCOUNT Dialogue aims to bridge this gap by posing questions that professionals might not think to ask, combining business acumen with data understanding to form new perspectives and accurate, diverse facts.
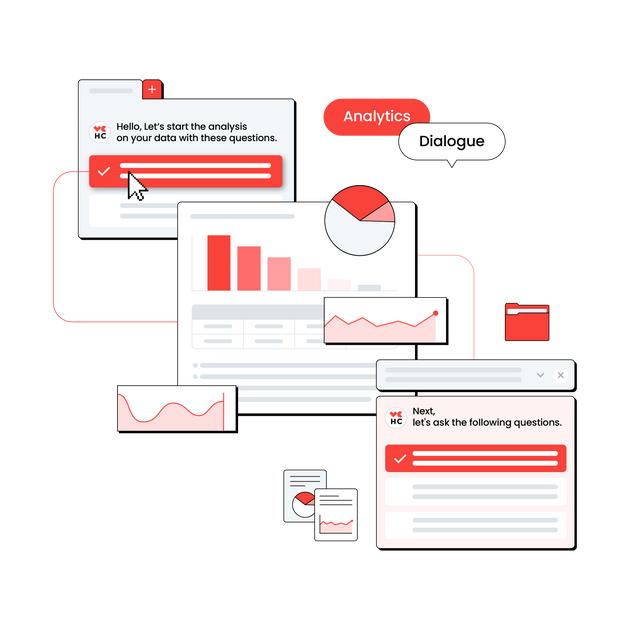
How Dialogue Works
Understanding the context behind data is crucial, as interpretations depend on the business context. This feature is designed to provide accurate facts and new perspectives, rather than definitive opinions, enabling professionals to form well-grounded opinions.
It not only poses questions but also provides quantitative answers, helping to uncover facts and insights that might be missed at a glance, like significant differences in sales between months.
To understand how Dialogue works, let's examine an example using Superstore Sales data. Shall we start with the broad question about annual monthly sales?
First, we'll draw a bar chart of the 'Sales by Order Date - Months of year' using Smart Plot, then press the Dialogue button.
- Dialogue doesn't just stop at asking questions; it starts by quickly and easily summarizing quantitative answers to those questions. It calculates facts that might be missed at a glance when looking at the chart (e.g., the difference between the maximum and minimum values, months with sales below average).
We found that the biggest difference in sales occurred between November and February (approximately $292.71K). Shall we delve deeper into the questions?
- When we break down the difference between November and February at the category level, we see that the increase and decrease in Technology were significant, and the rate of change was highest for Furniture (+669%).
- Someone familiar with the context in which the data was formed might quickly recall certain facts. For example, there might have been a promotional event for office supplies in November, or a disruption in supply in February due to a halt in trading with an office supplies vendor. In this way, the [Question-Answer] format presented by Dialogue shines when combined with the business capabilities of an industry professional familiar with the data context.
Then, where was the largest regional difference in sales for Furniture?
- In the East region, the increase and decrease amounted to approximately $35.64K.
Starting from the vague question, 'Should we check the monthly sales for the year?', we explored how a question leads to quantitative facts, which then lead to interpretations and new questions. With Dialogue, the process of asking questions and uncovering hidden patterns in the data is expected to be neither boring nor overwhelming.
Questions that could be raised
💡 If you've read this far, you might be wondering:
- The interpretation of facts made up of numbers inevitably requires understanding the business context in which the data was formed. For example, an increase in sales is positive, but an increase in the churn rate is negative. Rather than the data tool definitively stating opinions through numbers, we thought it important to provide accurate facts and new perspectives, enabling practitioners to form good opinions based on facts.
- In the future, this will be expanded to include all features of HEARTCOUNT, including the automatic analysis function.
Mission of team HEARTCOUNT
HEARTCOUNT, developed by the team at IDK Squared (IDK^2 - "I don't know what I don't know"), embodies the mission to sincerely understand (HEART) and count (COUNT) data. The tool is expected to reduce the time it takes to go from a vague question to insight, improving the quality of life and data utilization in business for its subscribers.
In conclusion, HEARTCOUNT Dialogue is a visualization and analysis tool designed for all practitioners, aiming to simplify the journey from data to decision-making and insights.
Log in with your Google account to try it right away.