- Bar Chart: Discuss quantitative sizes and differences through data.
- Time Series Analysis: Understand metric changes over time.
- Distribution: Talk about uncertainties through individual record visualization.
What is Data Visualization?
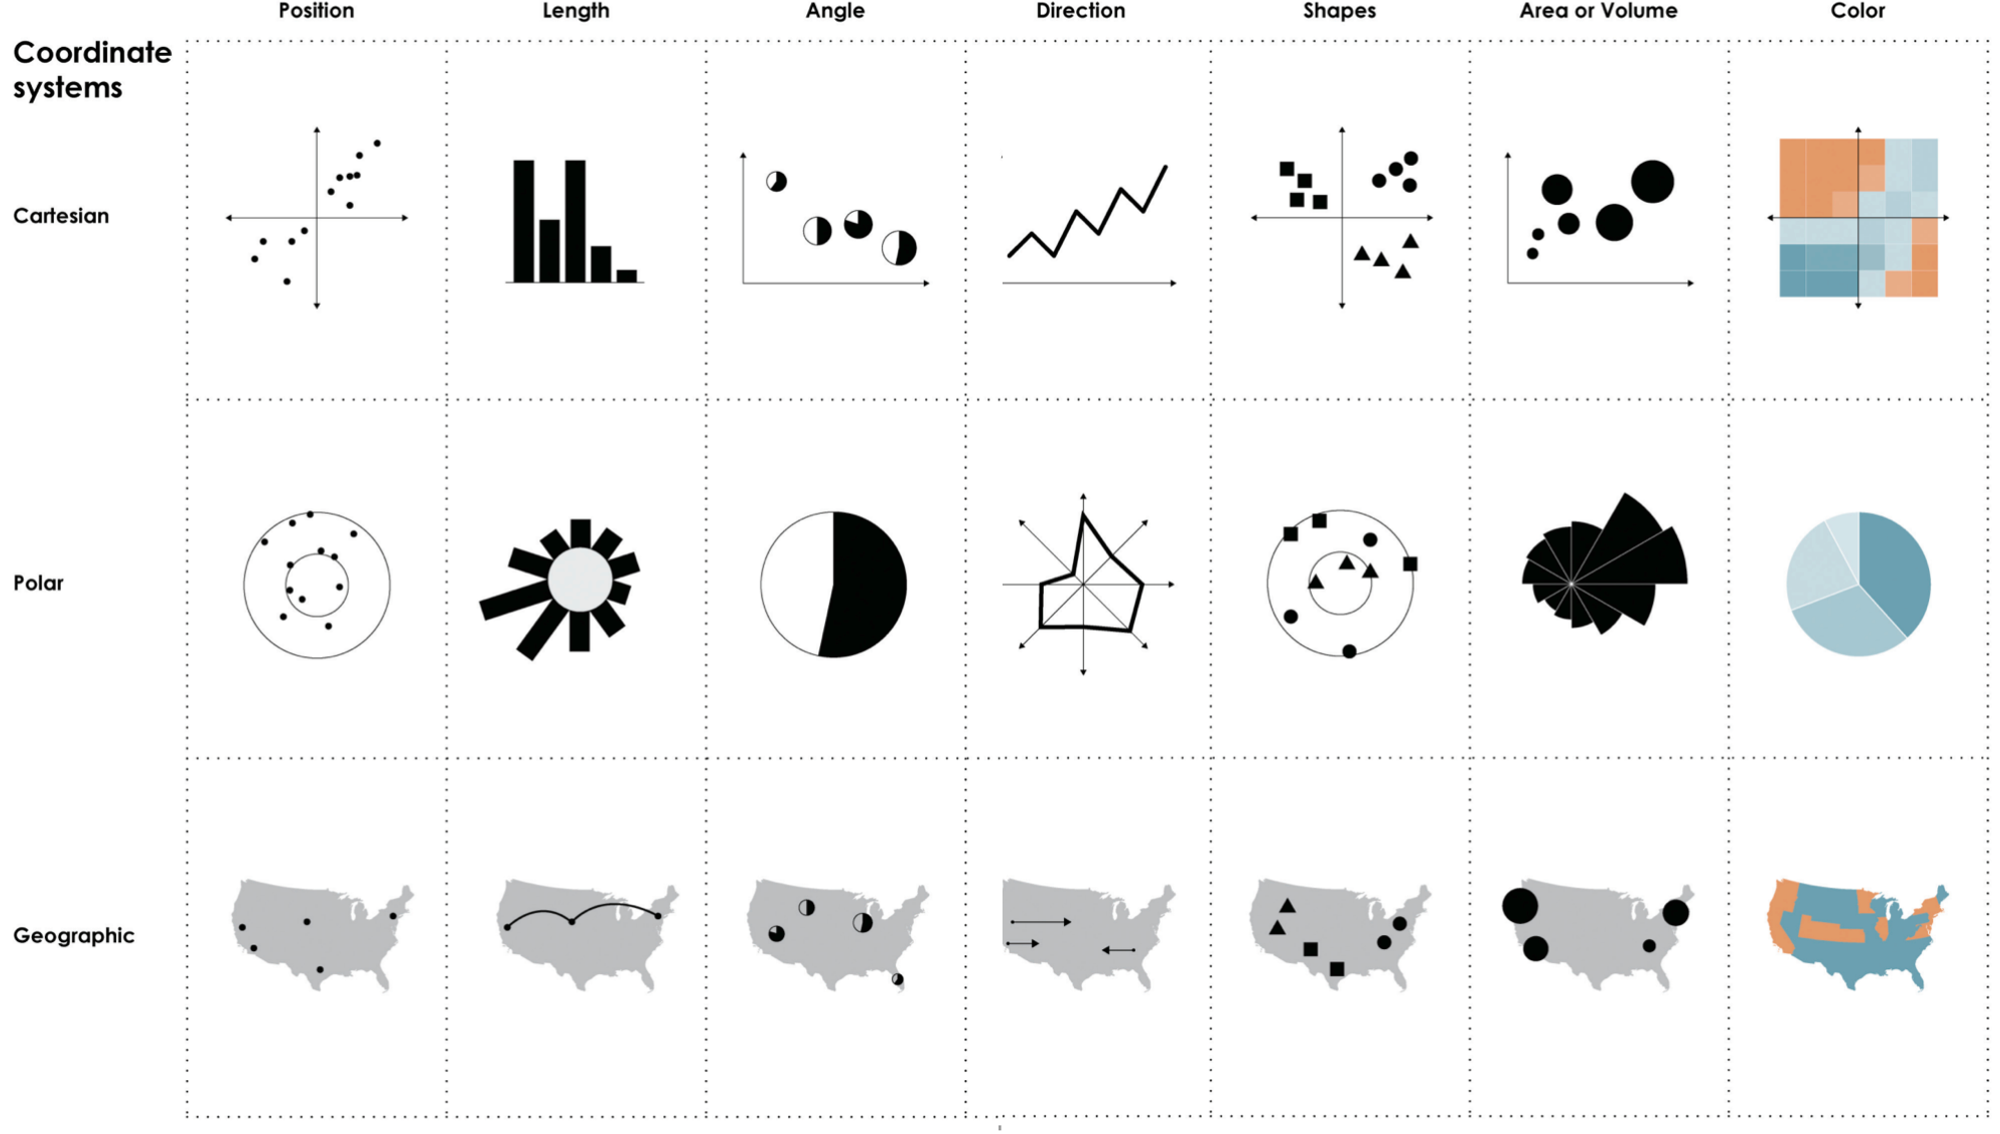
Simply defined, data visualization is representing numbers using points, lines, and shapes (surfaces), expressing them through size, position, and color. The fundamental value of data visualization stems from the fact that visual signals are easier to understand, remember, and base decisions on than raw data or numbers.
It's said that the human brain processes visual information at about 9Mb/sec, having evolved to interpret visual information effectively. On the other hand, viewing an Excel sheet is said to release cortisol, a stress hormone.
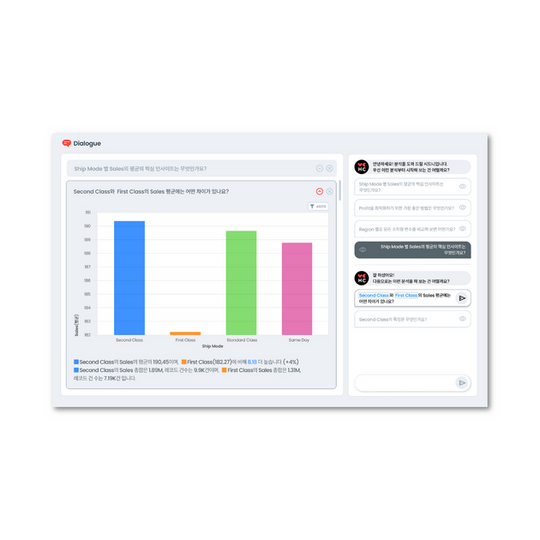
Medium: Data Visualization as a Means of Communication
Data visualization is a tool for conveying meaning, making it a medium. To function as a medium conveying data's significance, Data Visualization should answer the following questions:
- What data do you have?
- What do you want to know from the data?
- Which visualization method is effective to understand what you want?
- Is the visualization method chosen appropriate and effective?
Abstraction: Data Visualization as Reality's Abstraction
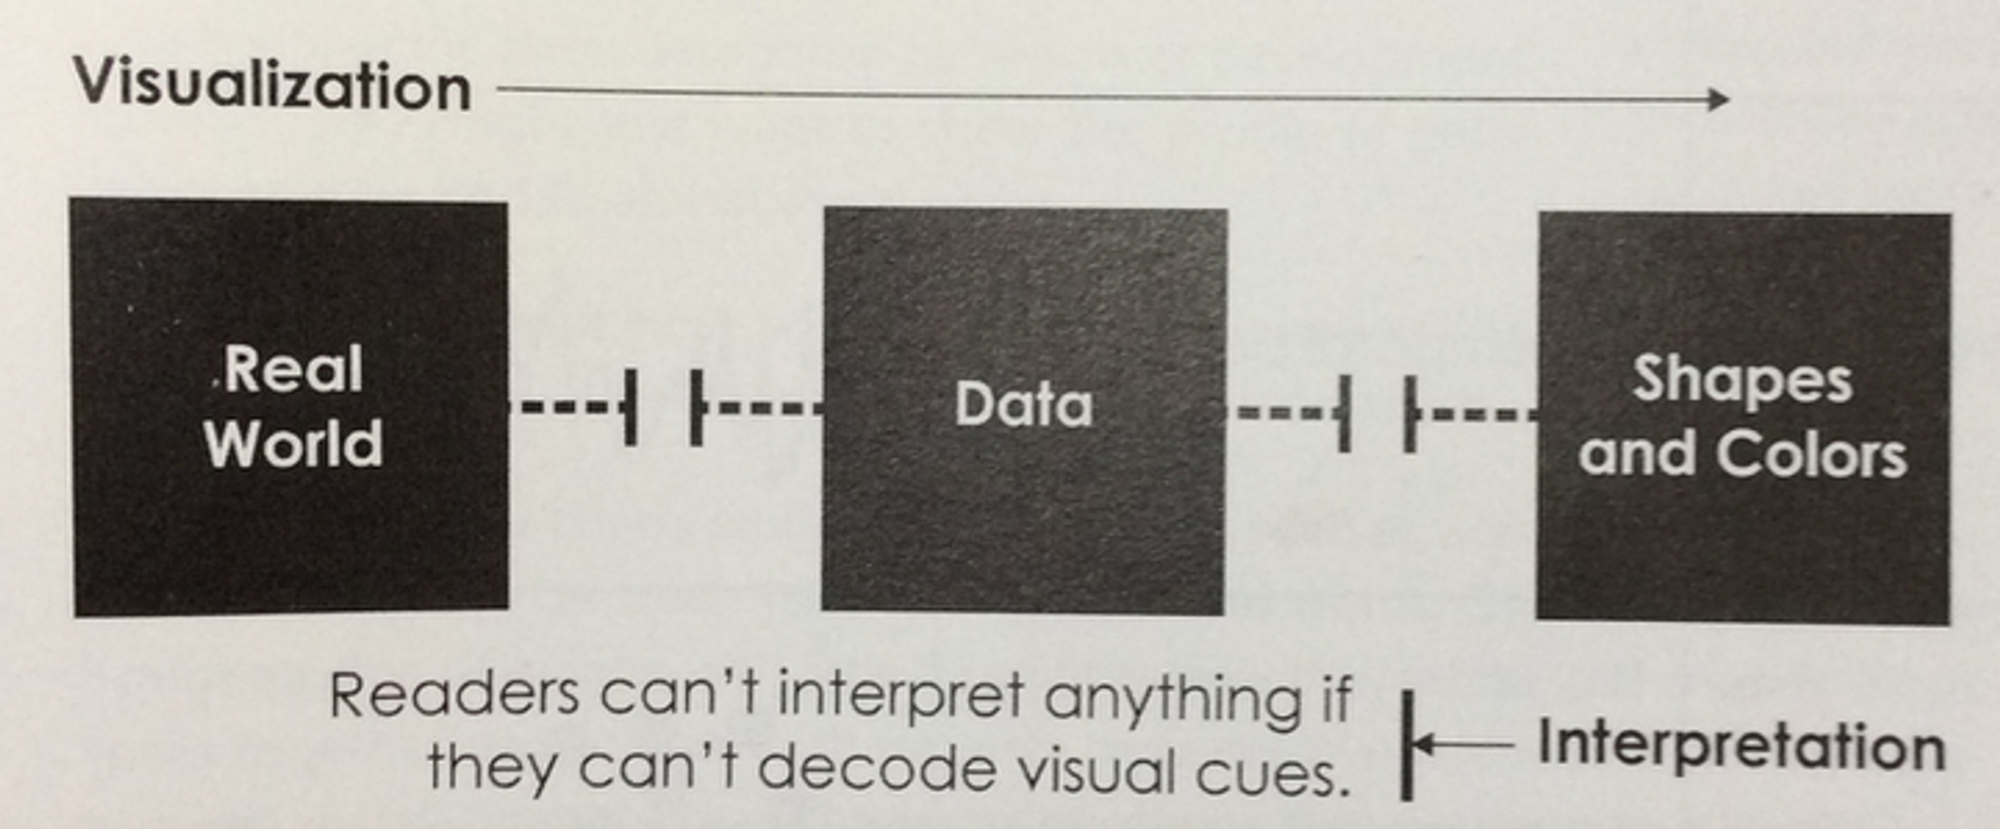
Data visualization can be seen as an abstraction of reality. Data collection samples the real world, while data visualization abstracts real-world samples, represented as data points, using visual elements.
Information inevitably gets deleted or compressed in the process of abstraction. If a user can't interpret the visual cues used in visualization, no matter how beautifully it's represented, it's a failed data visualization.
Statistical Narrative: Data Storytelling and Visualization
Visualization is often cited as a new form of Storytelling. The "story" here is closer to a statistical story than a traditional narrative. Data storytelling can hold more significance compared to traditional storytelling when it overcomes the episodic and incidental nature of anecdotal storytelling and speaks of patterns discovered through data. (Note: "anecdotal" can also mean "unsubstantiated".) This means data allows for inductive storytelling, showing consistent patterns and leading to a conclusion.
Related Content
Discover more of HEARTCOUNT's educational content: