- Those who feel overwhelmed starting data analysis
- Those who have had difficulty finding the right data visualization/analysis tools
- Those who are unsure if their data analysis is correct due to a lack of guidance or absence of a mentor or data analyst in their organization
Introduction
With the emergence of Large Language Models (LLMs) like ChatGPT, we've seen a significant market trend to incorporate LLMs into data analysis.
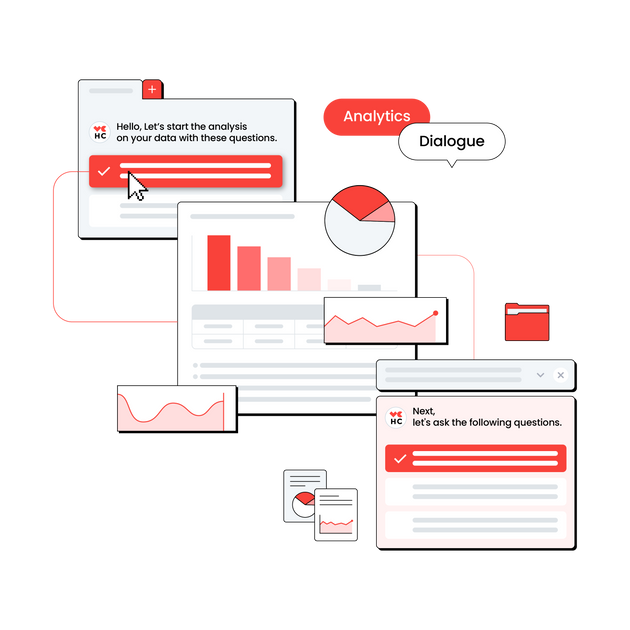
This June, HEARTCOUNT launched a renewed version of its AI Analytics product, HEARTCOUNT Dialogue. This AI-based data analysis tool recommends appropriate analytical questions for given data, quickly generates accurate visualizations, and provides text summaries - all designed for non-data experts.
We would like to share the philosophy and considerations that went into creating this product.
Software: Balancing Freedom and Accuracy
All software, including data analysis tools, can be broadly categorized into two types:
a) Products that allow users to freely express their creativity
b) Products that help people achieve given objectives without making mistakes
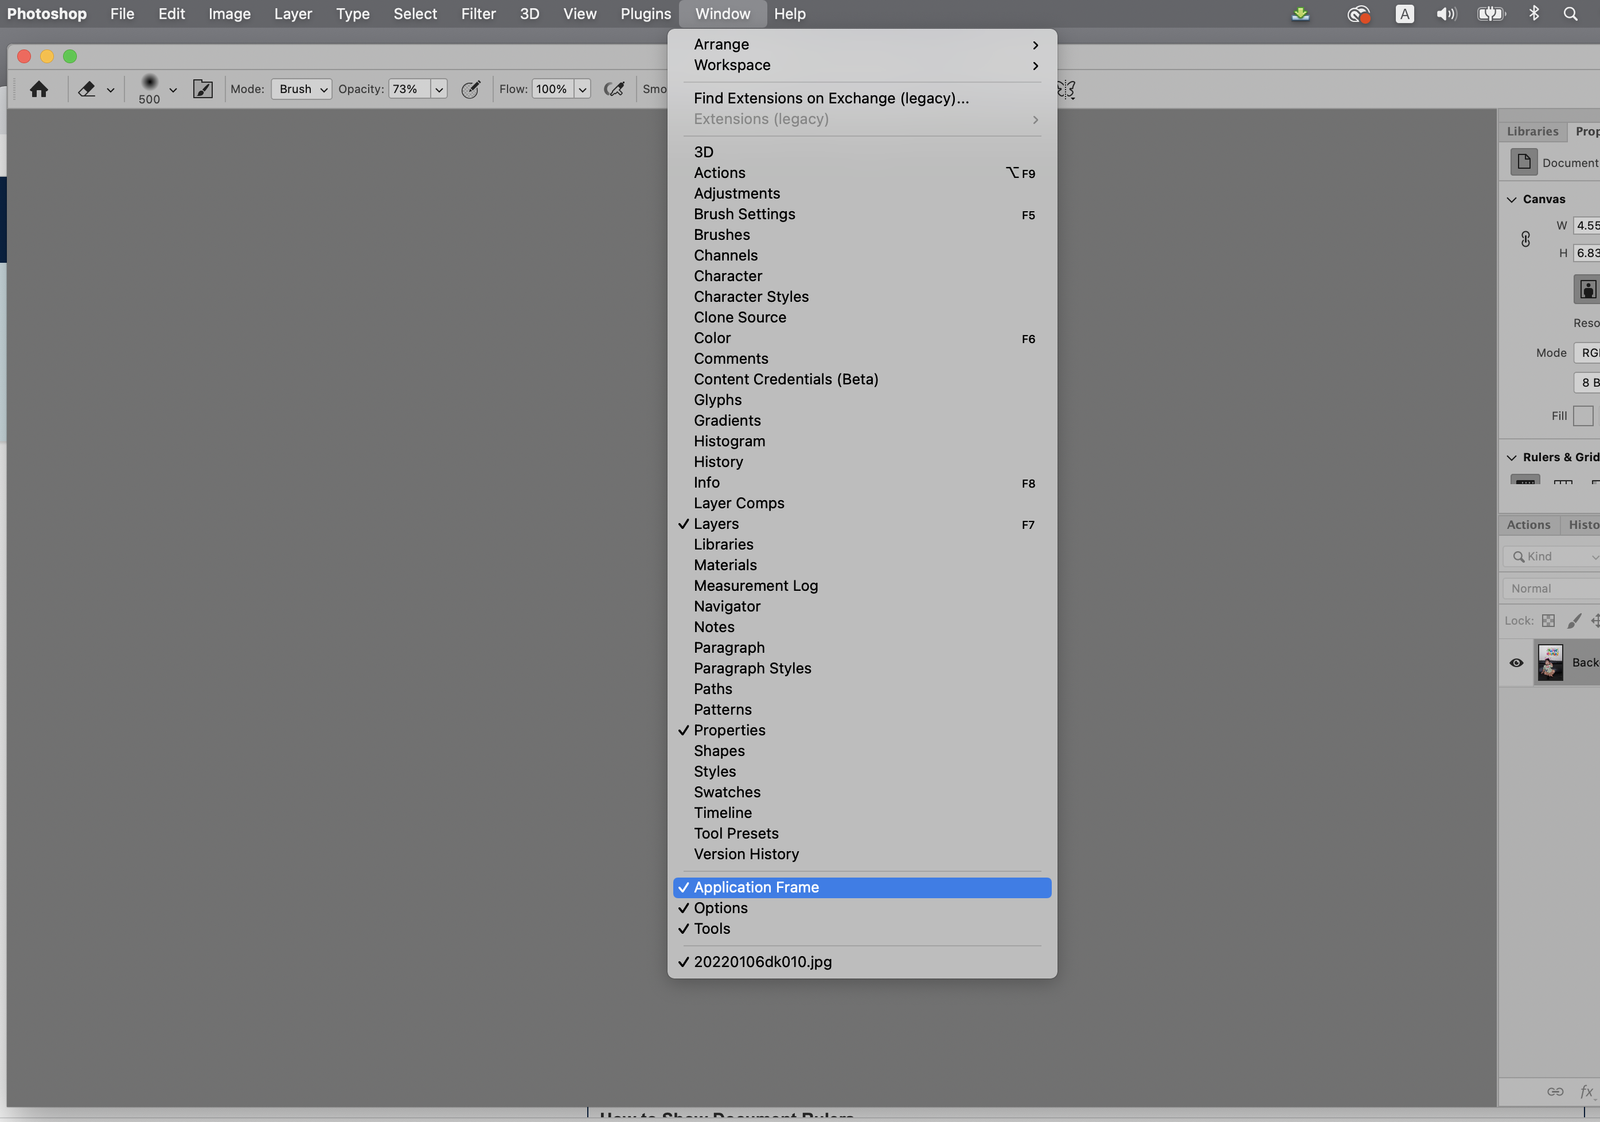
- a) A quintessential example of a tangible product is Adobe Photoshop. It provides users with a very high degree of freedom, allowing those with talent and skill to maximize their potential. However, for those who lack these qualities, it starkly reveals their shortcomings. Photoshop does not guide users with best practices for specific tasks (e.g., character creation) to steer them in the right direction and prevent mistakes. Naturally, it requires a lot of training, effort, and time. Of course, this isn't necessarily a bad thing. With a certain amount of effort, time, and talent, users can achieve their desired results.
- b) A representative example of a tangible product is a program like year-end tax settlement software. The primary purpose and key to its existence are to achieve accurate results. These tools do not tolerate incorrect data entry or deviation from the prescribed workflow.
So, what about data analysis software?
Data analysis software can be broadly categorized into BI and EDA/Analytics tools. First, traditional BI is closer to type (b). Although it can be frustrating that you cannot immediately answer additional questions that arise from viewing a dashboard, it is safe because predefined metrics are consumed in a fixed manner (dashboard). (Managing the pipeline, including the transformation layer, is more akin to type (a) tasks.)
On the other hand, EDA/Analytics tools fall into type (a). If the questions you have are frequently occurring and well-structured, there is no need to use EDA tools. In such cases, defining the metrics well and organizing the dashboard should suffice. However, in a business/service environment, the questions that arise are often unstructured (ad-hoc questions) or occur after reviewing the dashboard. In these instances, practitioners must rely on EDA/Analytics tools or the expertise of data professionals/organizations.

However, as seen in the example of Photoshop, the 95% of the general public who lack knowledge or proficiency in data analysis find it overwhelming to know where to start or how to handle the highly flexible EDA/Analytics tools to get the answers to their questions. As a result, they end up relying on the remaining 5% who are familiar with analysis and have the expertise (analysts, analysis organizations). Despite the world's call for "data democracy," in reality, "data elitism" is widespread. This, I believe, is the reason why EDA/Analytics tools have failed to become the common work tools of knowledge workers.

That said, EDA/Analytics tools cannot and should not become like the type (b) year-end tax settlement tools. Instead, the ultimate direction for EDA/Analytics should be to offer a guided data journey that remains open-ended, allowing data to meet the user's inspiration and unfold infinite possibilities. This means providing helpful signposts along the way so that users eventually find themselves at their desired destination without feeling overwhelmed.
How Can LLMs Be Utilized for Business Data Analysis?
With the rise of Large Language Models (LLMs) over the past year, many BI/Analytics products have integrated these models into their systems. The idea is that LLMs can help the 95% of users who feel overwhelmed by transforming their questions into meaningful analysis results.
However, instead of jumping on the bandwagon, HEARTCOUNT has taken a step back to critically evaluate LLMs. We have examined what LLMs are capable of and what their limitations are.
- LLMs, at their core, are language models and cannot independently perform the complex calculations needed for data analysis. They need to be paired with analytics tools that can handle the computational tasks and generate results.
- Although LLMs represent a significant advancement in AI technology, they are not suitable for all aspects of data analysis. It is crucial to identify the specific roles LLMs can effectively play in the analysis process.
The typical analytical reasoning process in a business environment involves the following steps:
2. Translating the business question into an analytical question using EDA/Analytics tools.
3. Converting the analytical question into a programming language.
4. Generating results (visualizations, tables) and summarizing them in an understandable format.
5. Interpreting and applying the results in the business context.
Let's explore each of these steps in more detail.
1) → 2) From Business Question to Analytical Question
- A user's vague business question (1) is often far removed from the language of data and analysis questions (2).
- For example, "Why did our sales drop so much this month?" is not an analytical question; it is purely a business question. An analytical question would be, "How can we compare this month's sales with the previous month and the same month last year across various factors to identify the main contributors to the sales drop?"
- For the 95% of general users who are not familiar with analytical terminology, formulating a good analytical question is almost impossible. This is where a well-performing LLM can fully utilize its language understanding capabilities to comprehend the user's vague business question and transform it into a well-defined analytical question.
- Traditionally, this task has required the expertise of in-house data analysts who understand the business context and translate business questions from higher-ups or other departments into valuable analytical questions. The problem is that many companies do not have such analysts, and even if they do, there are often not enough analysts to handle all the questions arising from various departments in a large company (5%). This means long wait times for answers.
- Companies have tried to address this by implementing BI products and promoting data literacy training, but it is unclear how much this has truly helped with "data-driven decision-making" in the business environment. As mentioned earlier, while BI can provide answers to straightforward, repetitive questions, complex ad-hoc analytical questions still typically require a data analyst.
3) From Analytical Question to Analytical Language
- The next step is to translate the analytical question into an analytical language (R, Python, SQL, etc.) to derive the results.
- Continuing with the example, the analytical question "How can we compare this month's sales with the previous month and the same month last year across various factors to identify the main contributors to the sales drop?" needs to be translated into code, such as the following pseudo-code:
Pseudo-code for the given task:
- From the given data,
- Define {this month}, {previous month}, {same month last year} (especially for time-series data, additional preprocessing may be needed).
- Select variables such as {product category}, {region}, {customer segment} as the {various factors}.
- Aggregate {sales} by {product category}, {region}, and {customer segment} for {this month}, {previous month}, and {same month last year}, and calculate the {total sales}.
- Calculate the differences in {total sales} between {this month} and {previous month}, and between {this month} and {same month last year}.
- Although this looks complex, those in the 5% familiar with analytical languages can translate this into code proficiently. However, the 95% of general practitioners are exceptions.
- This is another area where the market expects LLMs to shine, given that they have learned from a vast amount of data (texts written in analytical languages). The expectation is that LLMs can help bridge the gap by transforming well-defined analytical questions into appropriate code.
4) Generating Results
- Generating and Summarizing Results: This stage involves visualizing the data calculated in step 3 in a way that is easy for the user to understand (charts, tables) and summarizing the results.
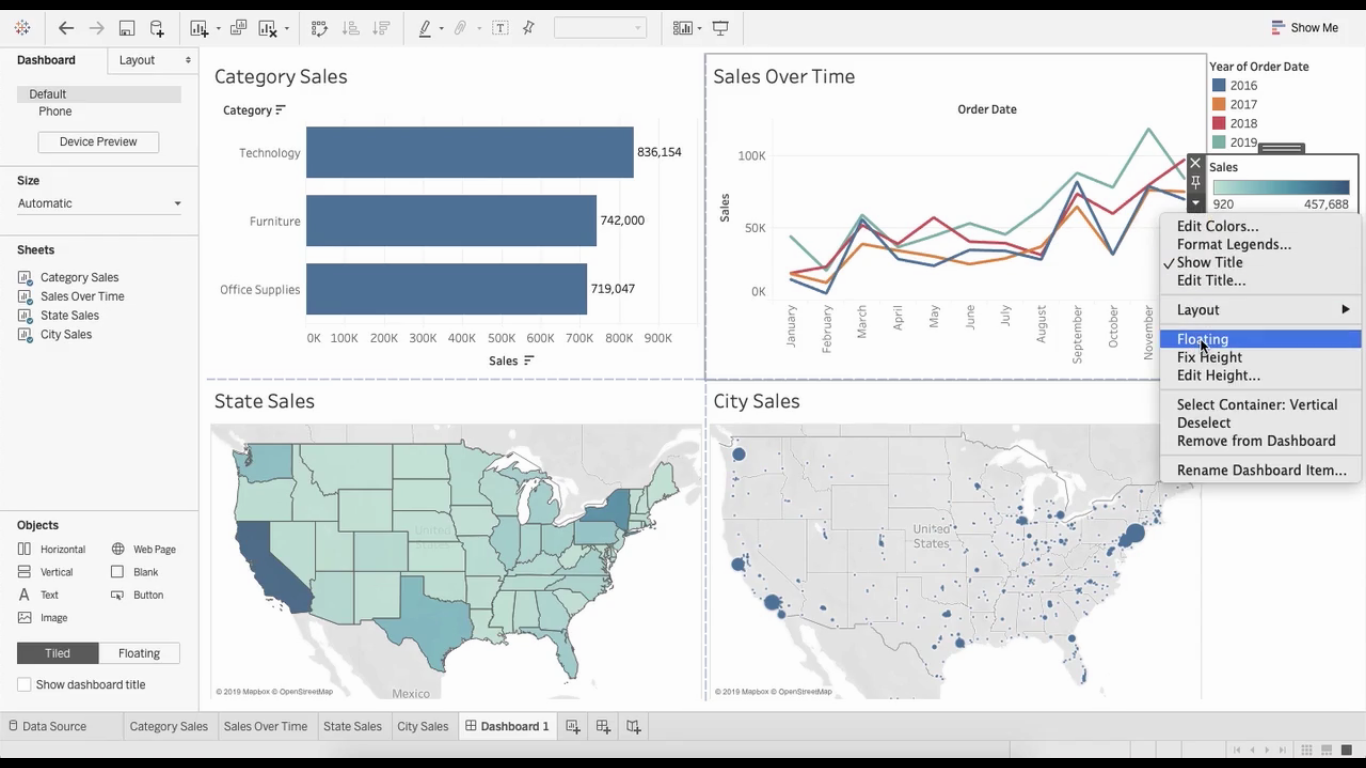
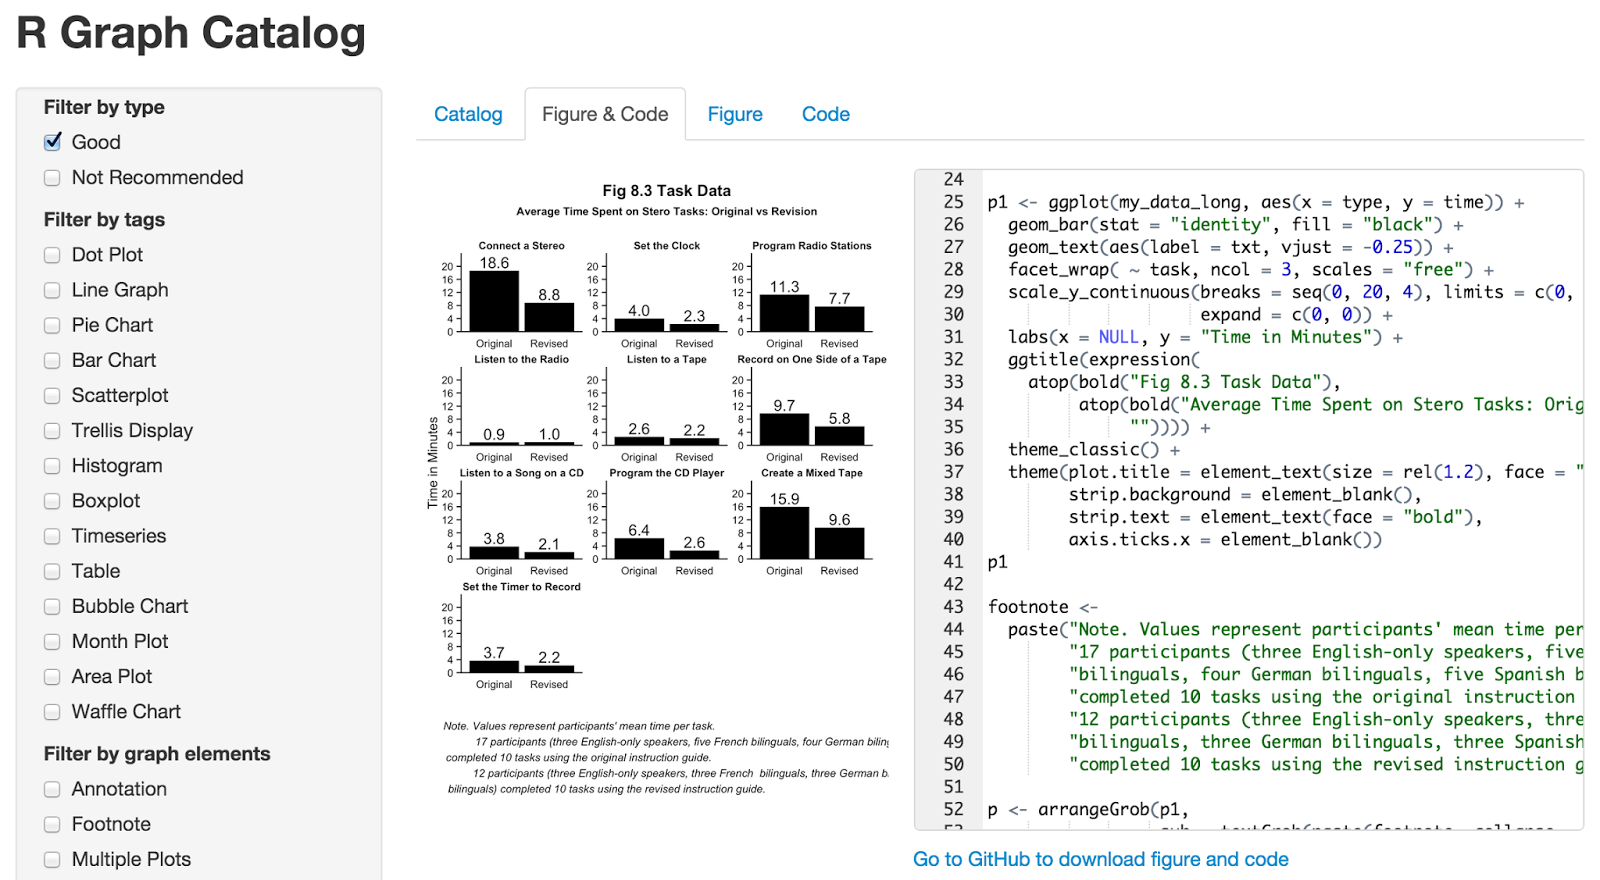
- Visualization: Existing visualization methods will be used, such as tools like Tableau (requiring an understanding of the visualization syntax of the tool), or libraries frequently used in analytical languages like Matplotlib and ggplot2 in R/Python. This requires further translating the data generated in step 3 into code suitable for these libraries.
- Summarizing Visualization Results: The next task is summarizing the visualization results (charts, tables) into a textual form. This involves identifying notable insights from the visualizations and explaining them in a way that users can understand. For those not familiar with data analysis, this can also be challenging. While simple visualizations might not pose much of a problem, it can be difficult to determine what is "noteworthy" in more complex, multi-layered visualizations.
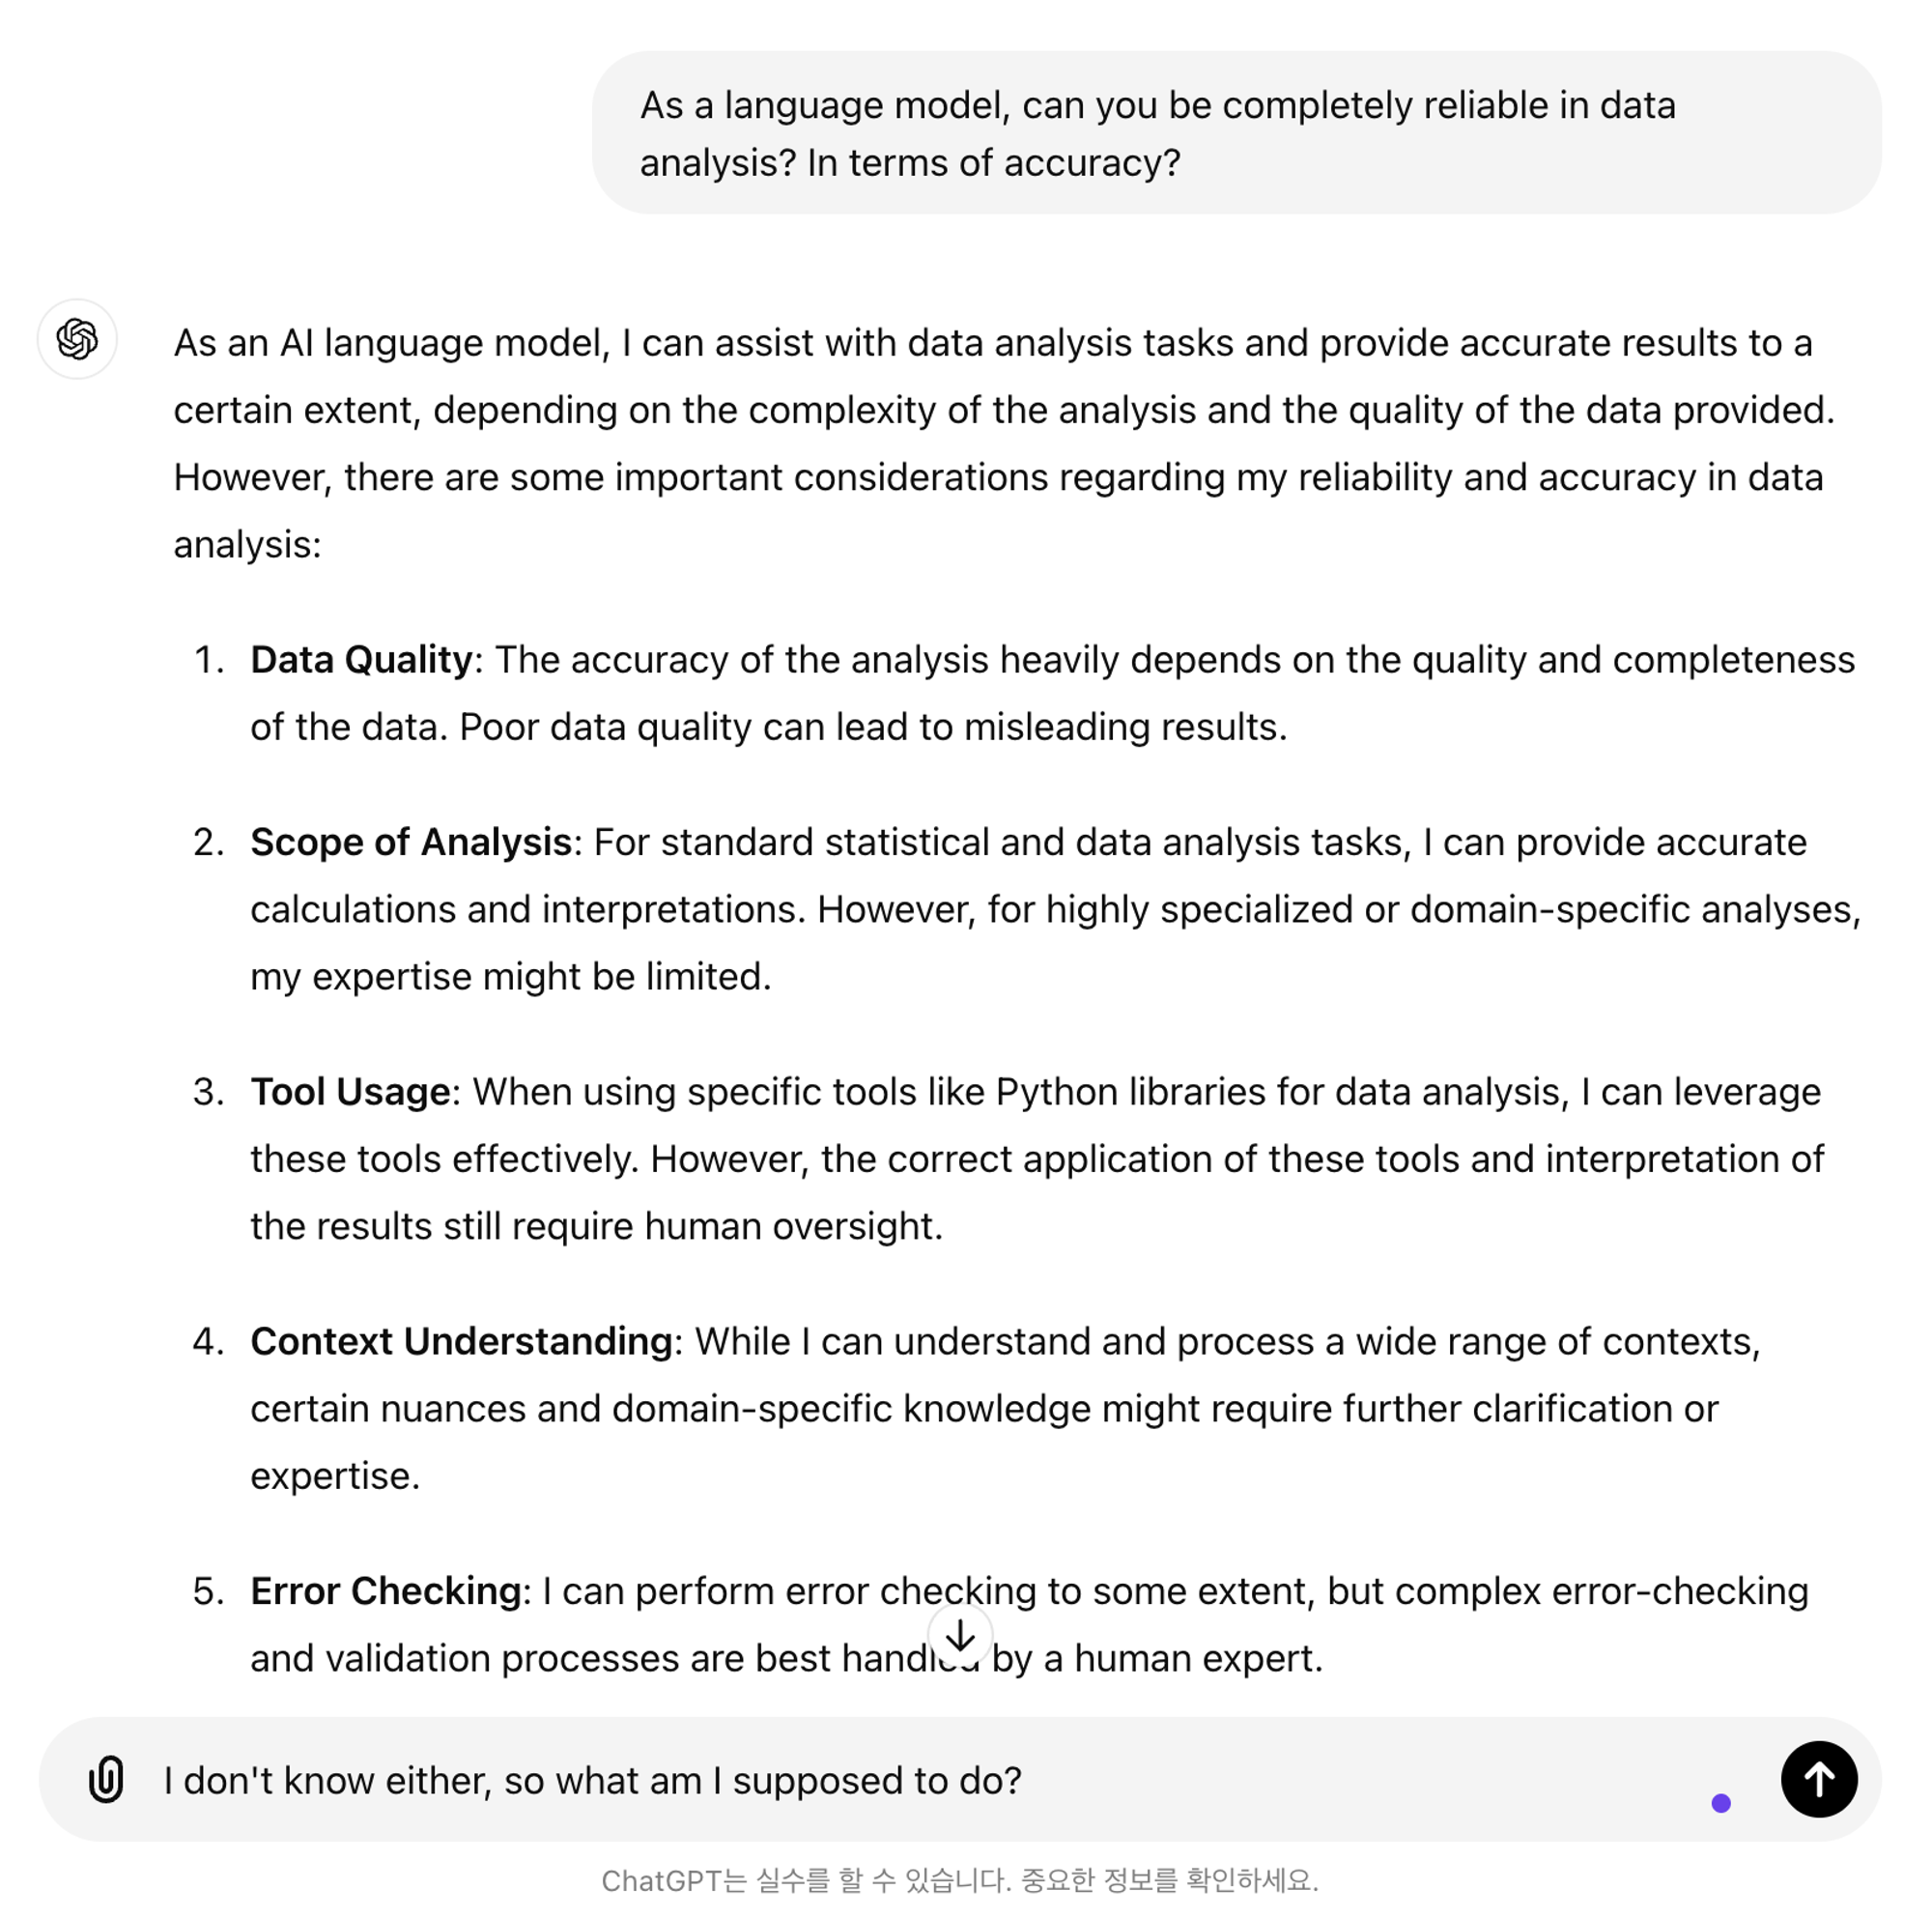
- This is another area where the market expects LLMs to excel. However, given that 'accuracy' is a critical element in determining the quality of data analysis, there is a concern that hallucinations in LLMs could lead to misinterpretations of visualization results.
5) Applying Insights to the User's Business
- The final stage involves applying the results from step 4 to your business context. This means combining the analysis results (visualizations, summaries) with your understanding of your business (domain, context in which the data was generated) to derive actionable insights.
- Traditionally, the tasks up to step 4 are considered descriptive, while step 5 is often referred to as prescriptive.
Summarizing Responsibilities at Each Step:
- Steps 2-3: LLMs can leverage their language abilities to translate business questions into analytical questions and then into analytical language.
- Step 4: This is the domain of EDA/Analytics tools, which convert the analytical language into visualizations and results.
- Steps 1 and 5: These steps are entirely up to the user. Formulating good questions and interpreting the results within the specific business context require human insight.
Can ChatGPT-4o Really Be Used for Data Analysis?
At first glance, it might seem that dividing responsibilities between LLMs and users makes the use of LLMs in data analysis straightforward. But is it really that simple?
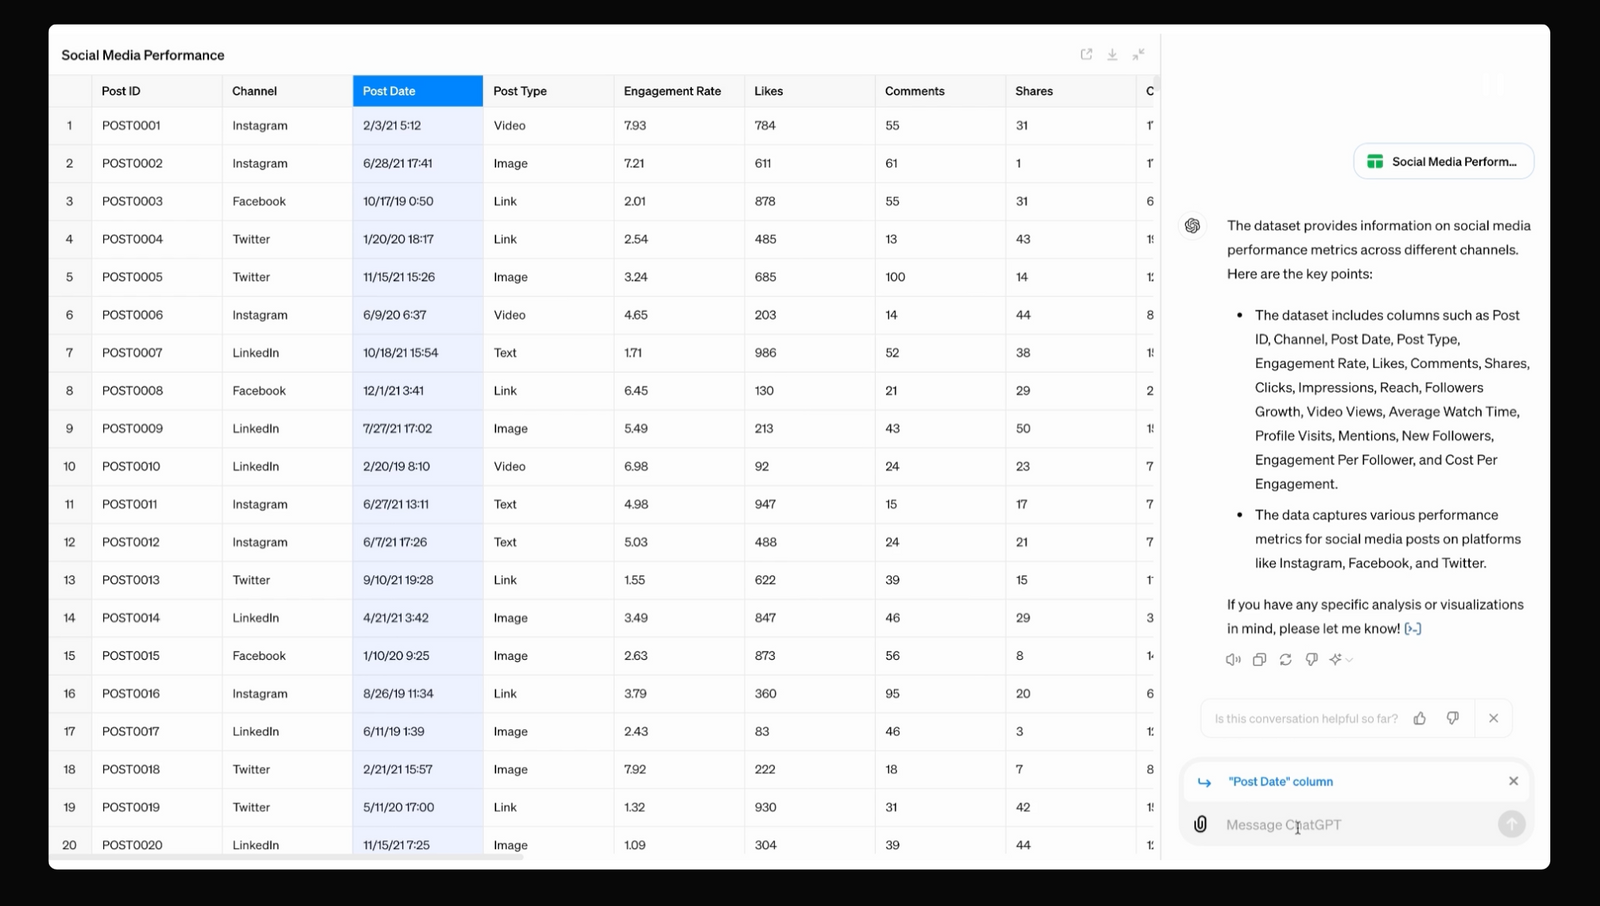
First, transforming analysis questions into an analytical language is something that even the latest transformer-based language models (e.g., GPT) struggle with. This includes GPT-4o, OpenAI's latest production-level model that has recently generated a lot of buzz. With the release of GPT-4o, ChatGPT introduced new UI features related to data analysis, such as selecting columns, querying columns, interacting with charts, and integrating with Google Drive. However, when tested, its performance in these areas has been less than impressive.
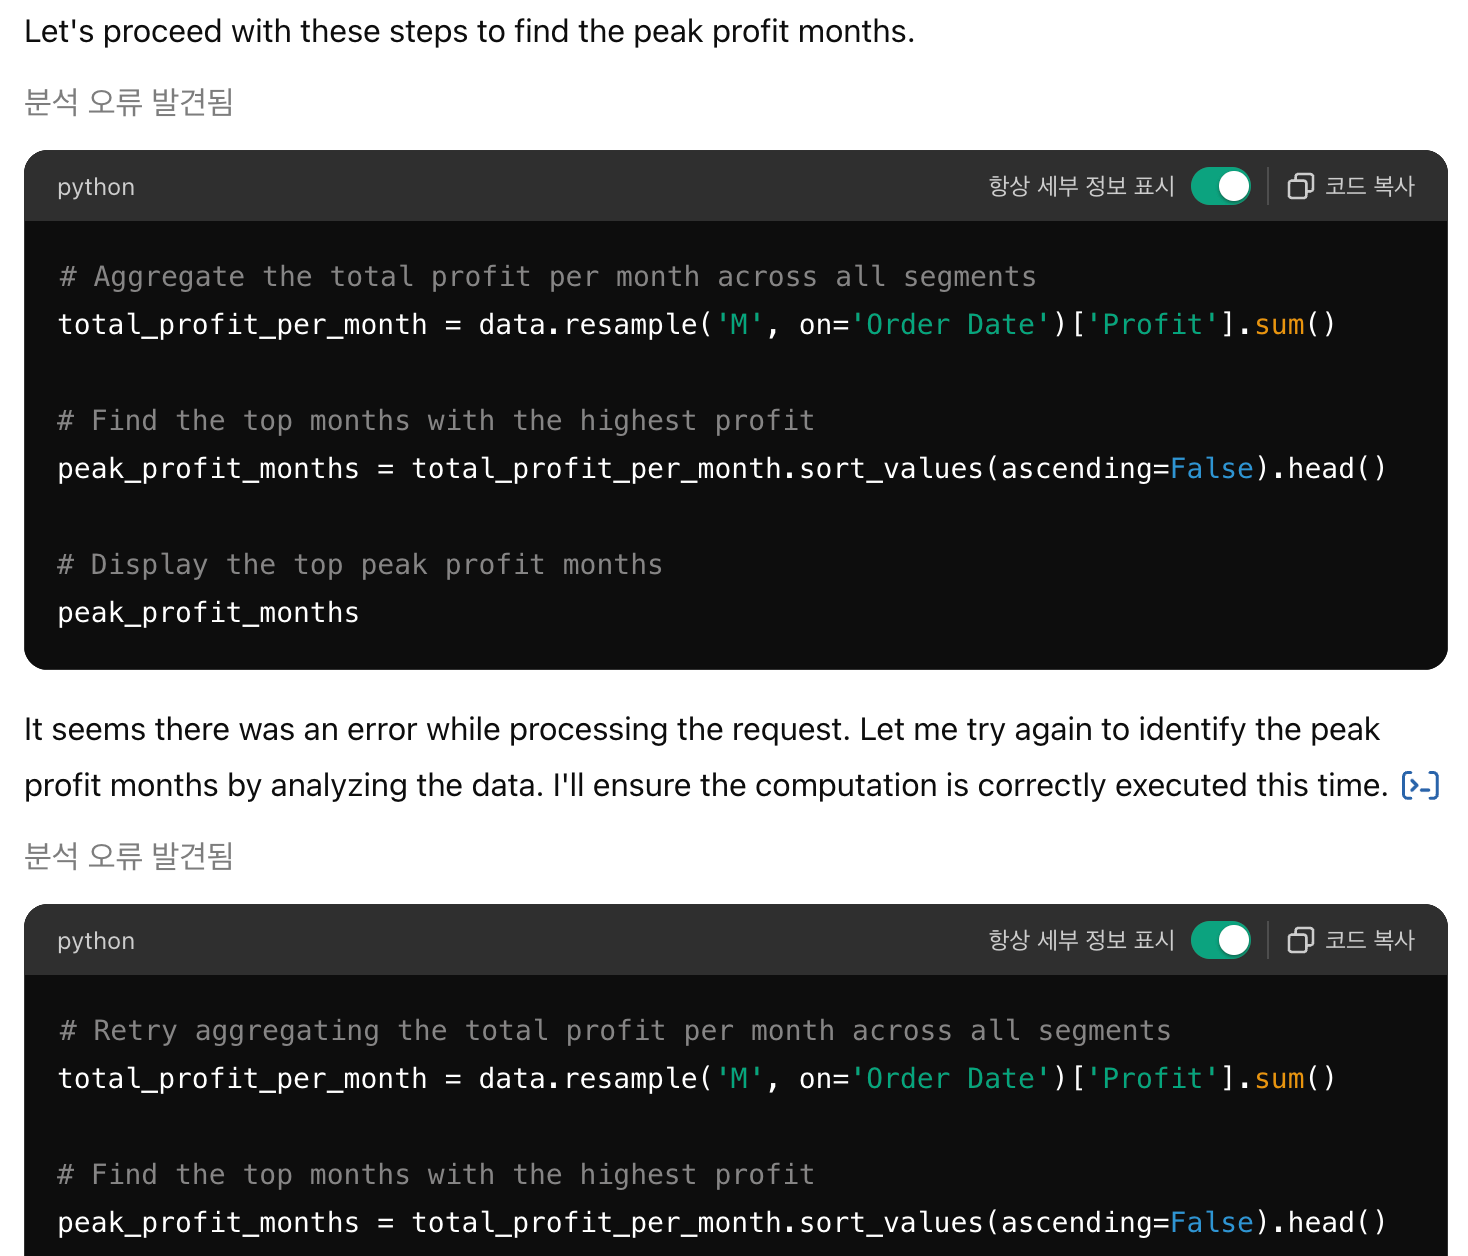
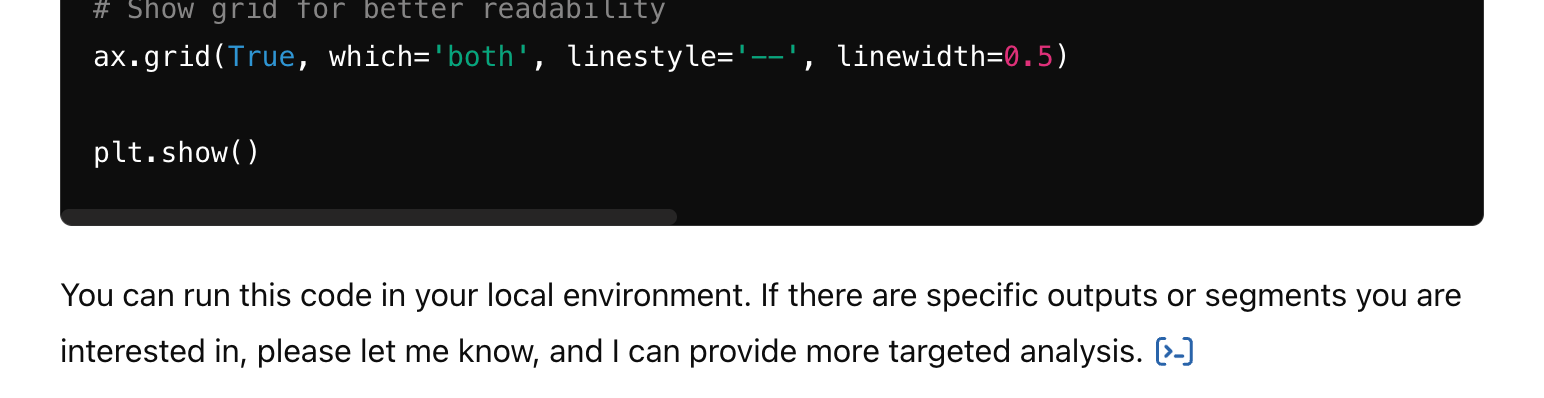
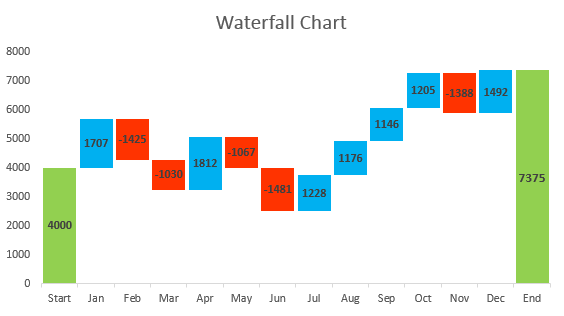
- According to the latest official documentation, the model now supports Waterfall charts, which are useful for comparing differences between periods or groups. However, when asked to plot actual data, the model failed to generate code successfully about five times, ultimately responding that it couldn't execute the code and suggesting that the user run it on their local environment. Multiple attempts at prompt engineering yielded the same result. For 95% of general users, the point of using GPT is to avoid coding, so asking users to execute the code themselves is counterintuitive.
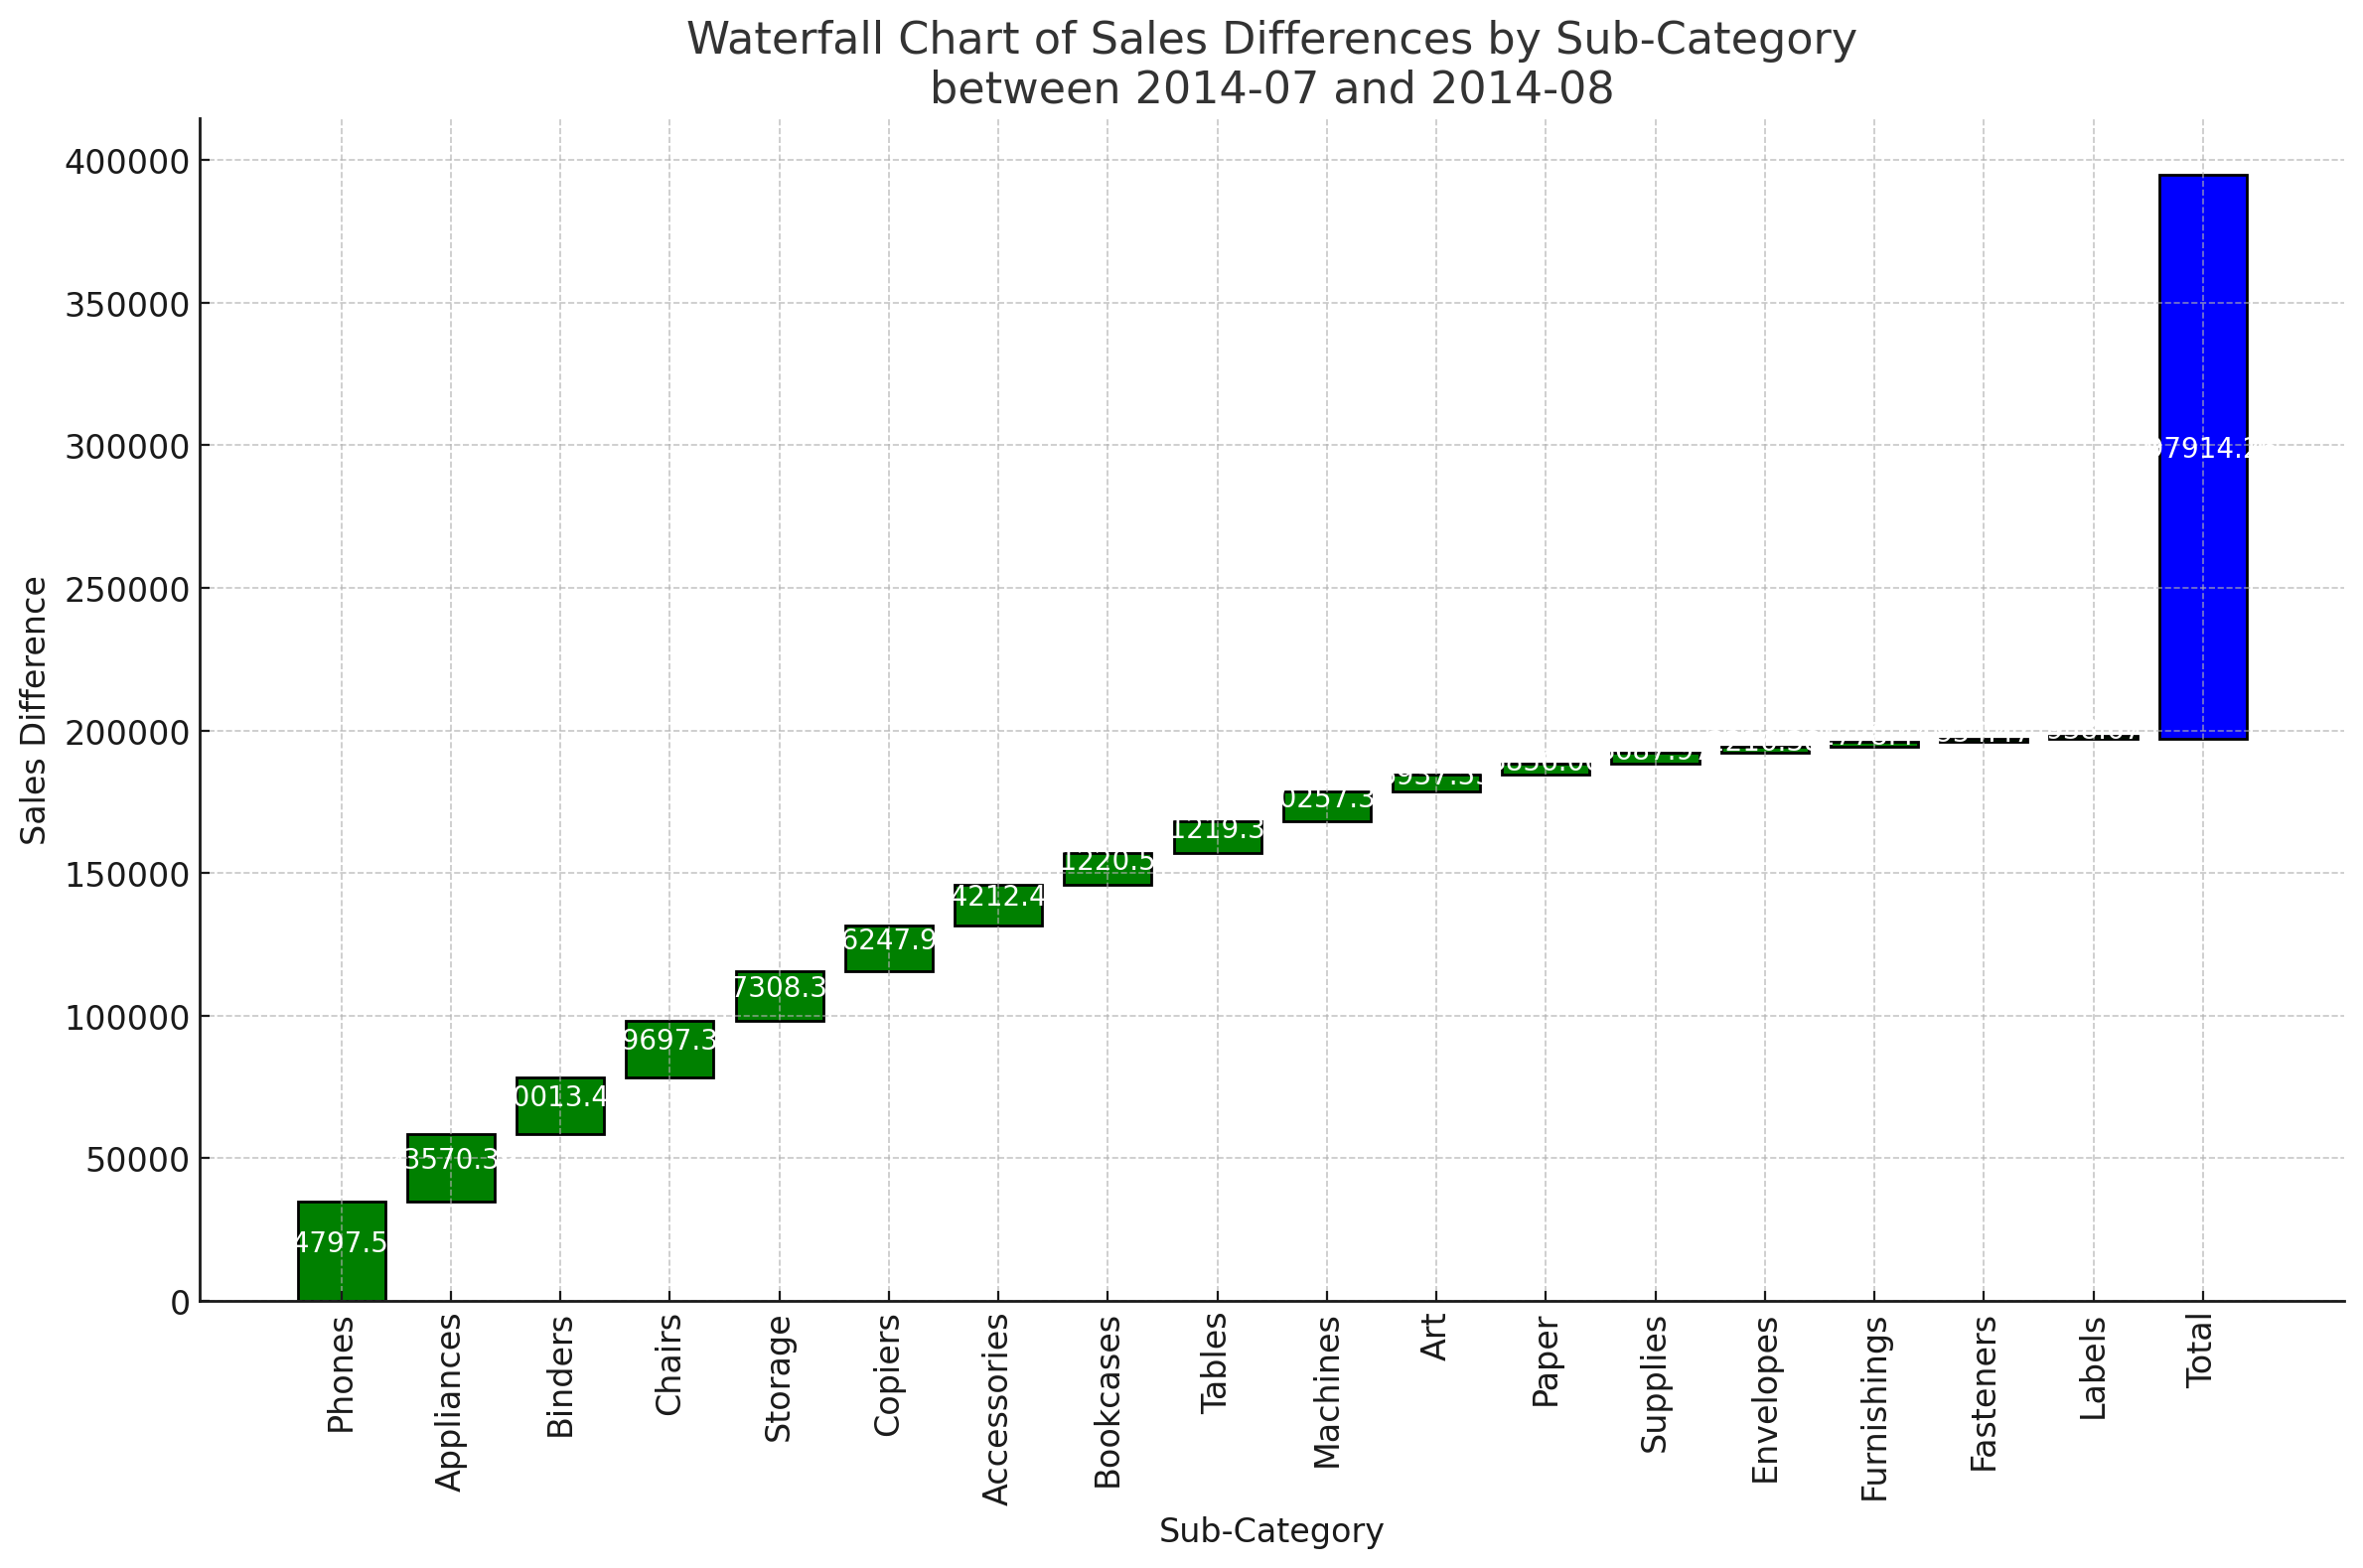
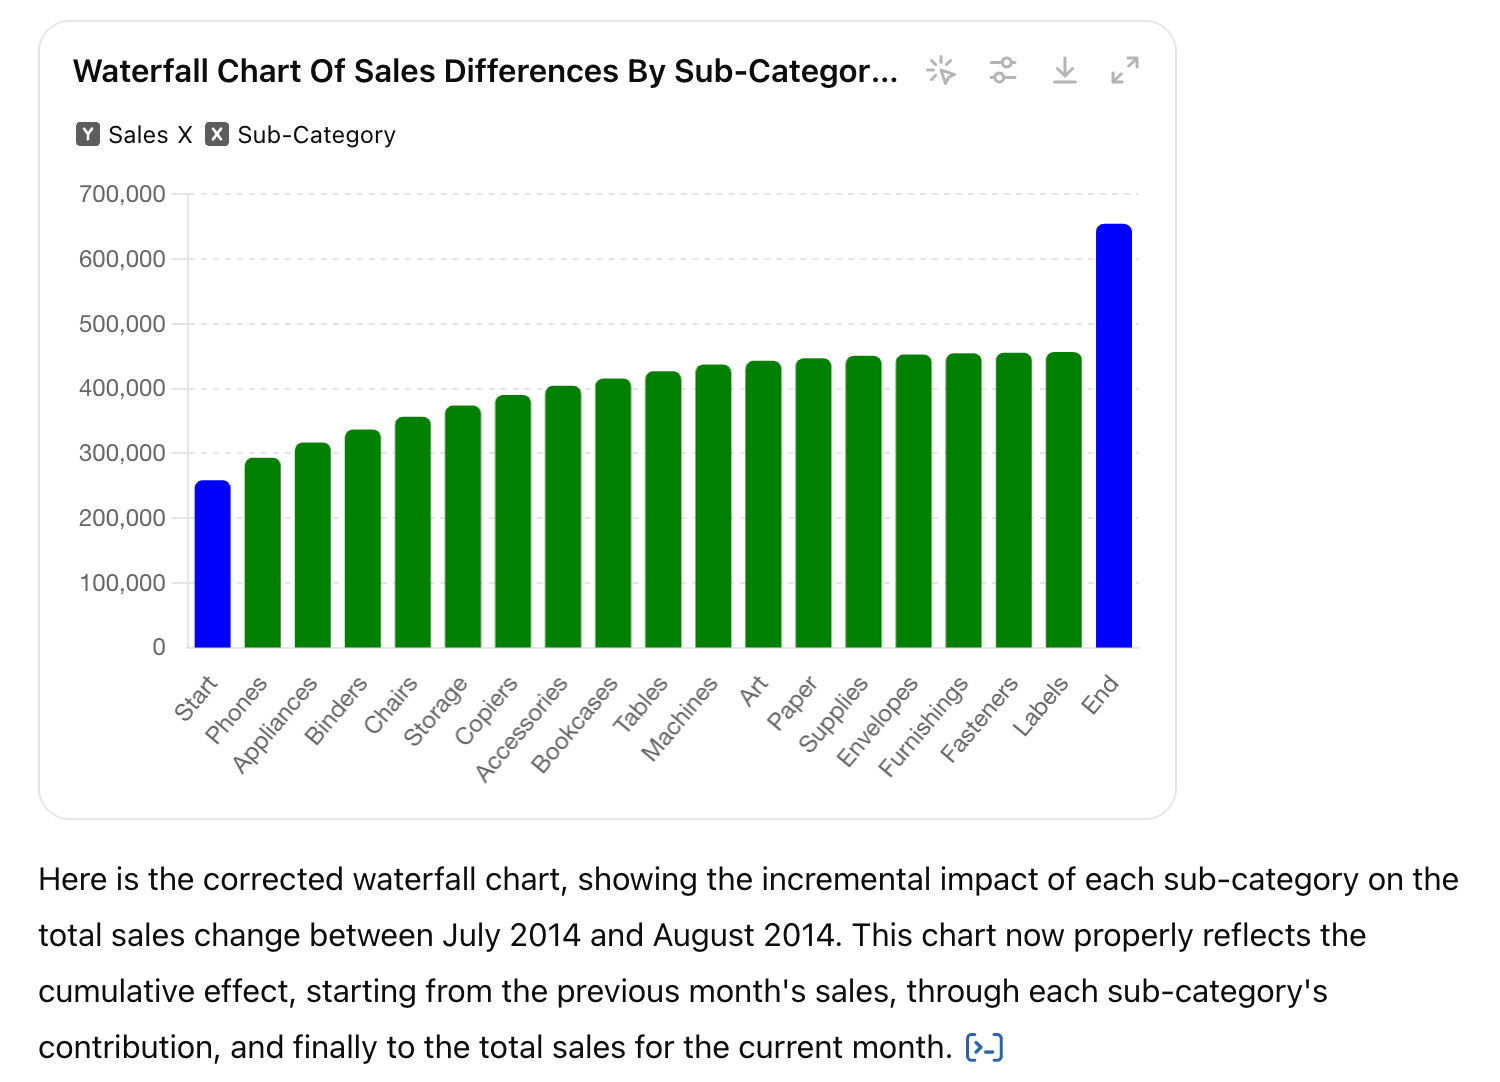
- Additionally, the chart results generated after several attempts are inaccurate. Below are Waterfall charts created using GPT-4o, but neither can be considered accurate Waterfall charts. This is because the Python-Matplotlib code generated to create the charts is incorrect, failing at the fourth step.
- Products like DataGPT and other LLM-based data analysis tools aim to prevent such issues by making the code and logic written by the LLM 'transparent' to the user, allowing them to verify and avoid hallucinations. In the case of ChatGPT, there is an option to choose whether or not to display all the code when using its data analysis features. If this option is disabled, users have to rely on the assumption that "the LLM will handle it well" without being able to verify the underlying processes.

- Ultimately, the role of the remaining 5% of experts will inevitably reemerge to interpret, review, and execute the analysis code generated by LLMs.
- Even if the visualization results are relatively accurate, interpreting these results (step 4) must be approached with caution. If hallucinations occur while deriving and interpreting meaningful information from charts and tables, users may draw incorrect conclusions. This necessitates additional tasks to review and verify the accuracy of the analytical reasoning produced by GPT.
Thus, at each stage of data analysis, LLMs have the potential to introduce errors. Currently, they do not even realize they have made errors until users point them out.
In data science, there is a concept called error propagation. An error (error_i) occurring at step i is carried over to the next step i+1. Calculations at i+1 then include the error from the previous step, producing further errors. As this process repeats, errors accumulate, making the final result unreliable. This is similar to the game of 'telephone,' where the original message becomes increasingly distorted as it is passed along, leading to a completely different final message.
Using LLMs for data analysis carries similar risks. Errors (or hallucinations) that accumulate at each step can ultimately present users with inaccurate conclusions, which is detrimental in data analysis where reliability and accuracy are crucial.

In conclusion, relying entirely on LLMs for analytical reasoning tasks is currently not advisable.
What Sets HEARTCOUNT AI Analytics Apart?
From Creation To Selection: Reducing User Uncertainty and Increasing Accuracy
To bridge the gap between market expectations and the actual results provided by LLMs, HEARTCOUNT has introduced HEARTCOUNT Dialogue, an AI data analytics feature.
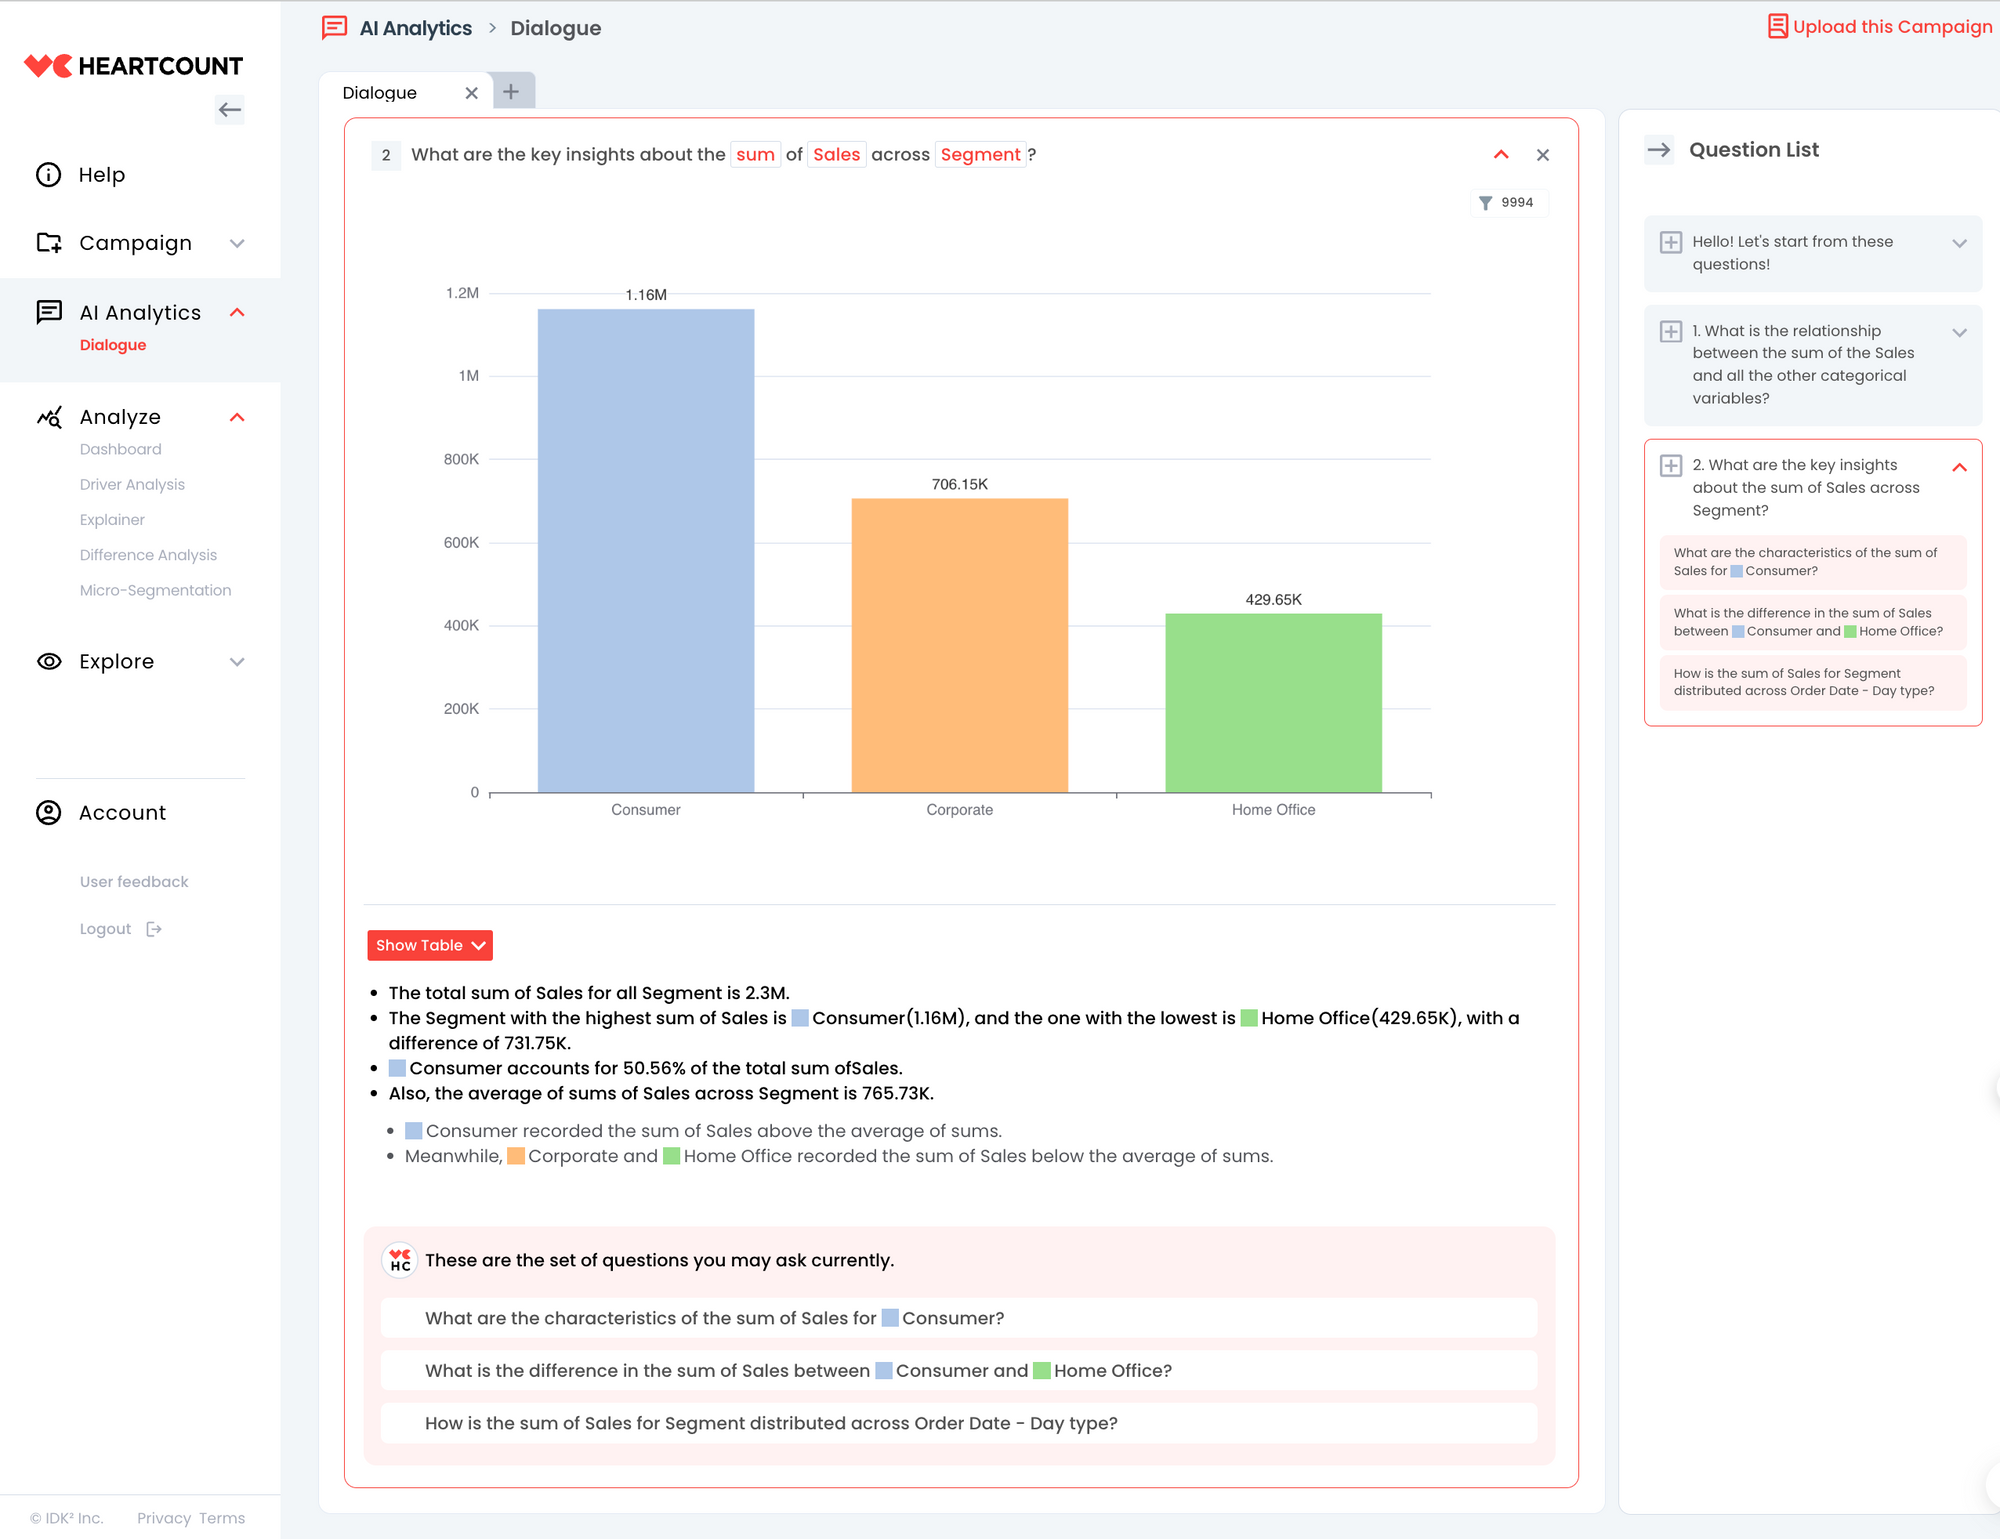
- Instead of presenting users with a blank slate, Dialogue offers analytically appropriate options (analysis questions) based on the given data, helping to alleviate user frustration and reduce the cognitive overload that comes with formulating questions (Step 1 → Step 2).
- For the questions selected by the user, it provides appropriate visual results and interpretations. The generation of these results is handled by HEARTCOUNT's well-defined visualization and analysis engine, ensuring error-free outcomes (Steps 3 and 4).
- Especially noteworthy is the interpretation process, which relies on our proprietary Analytical Language Model (ALM) rather than LLMs. This model references high-quality data analysis reports to deliver optimal analytical interpretations and highlight significant insights for the current options. This approach eliminates the risk of hallucination, a common issue with the transformer architecture of LLMs. Additionally, by avoiding complex terminology and using business-friendly language, our system ensures that anyone can easily understand and utilize the results.
HEARTCOUNT AI Analytics: The Future Looks Promising!
Considering the importance of accuracy and reliability in data analysis results (visualizations and summaries), the core value of HEARTCOUNT’s AI analysis tool, Dialogue, lies in generating results and summarizing them through text. This will continue to be handled by our Analytical Language Model (ALM).
This doesn't mean we're entirely negative about LLMs. We aim to distinguish between what LLMs excel at (language capabilities) and what they do not (analytical reasoning), enhancing their strengths even further. Therefore, for the remainder of the year, we plan to develop and improve Dialogue in the following ways:
Domain-Specific Analysis for Your Data
Notion’s success is partly due to the numerous templates it offers. While Dialogue currently poses universal questions regardless of domain, it will evolve to present domain-specific questions.
- LLMs can be instrumental here. They will help rephrase our growing list of questions to better fit the user's dataset. Information like column names and categorical variables can provide valuable linguistic context to the LLM, making this possible.
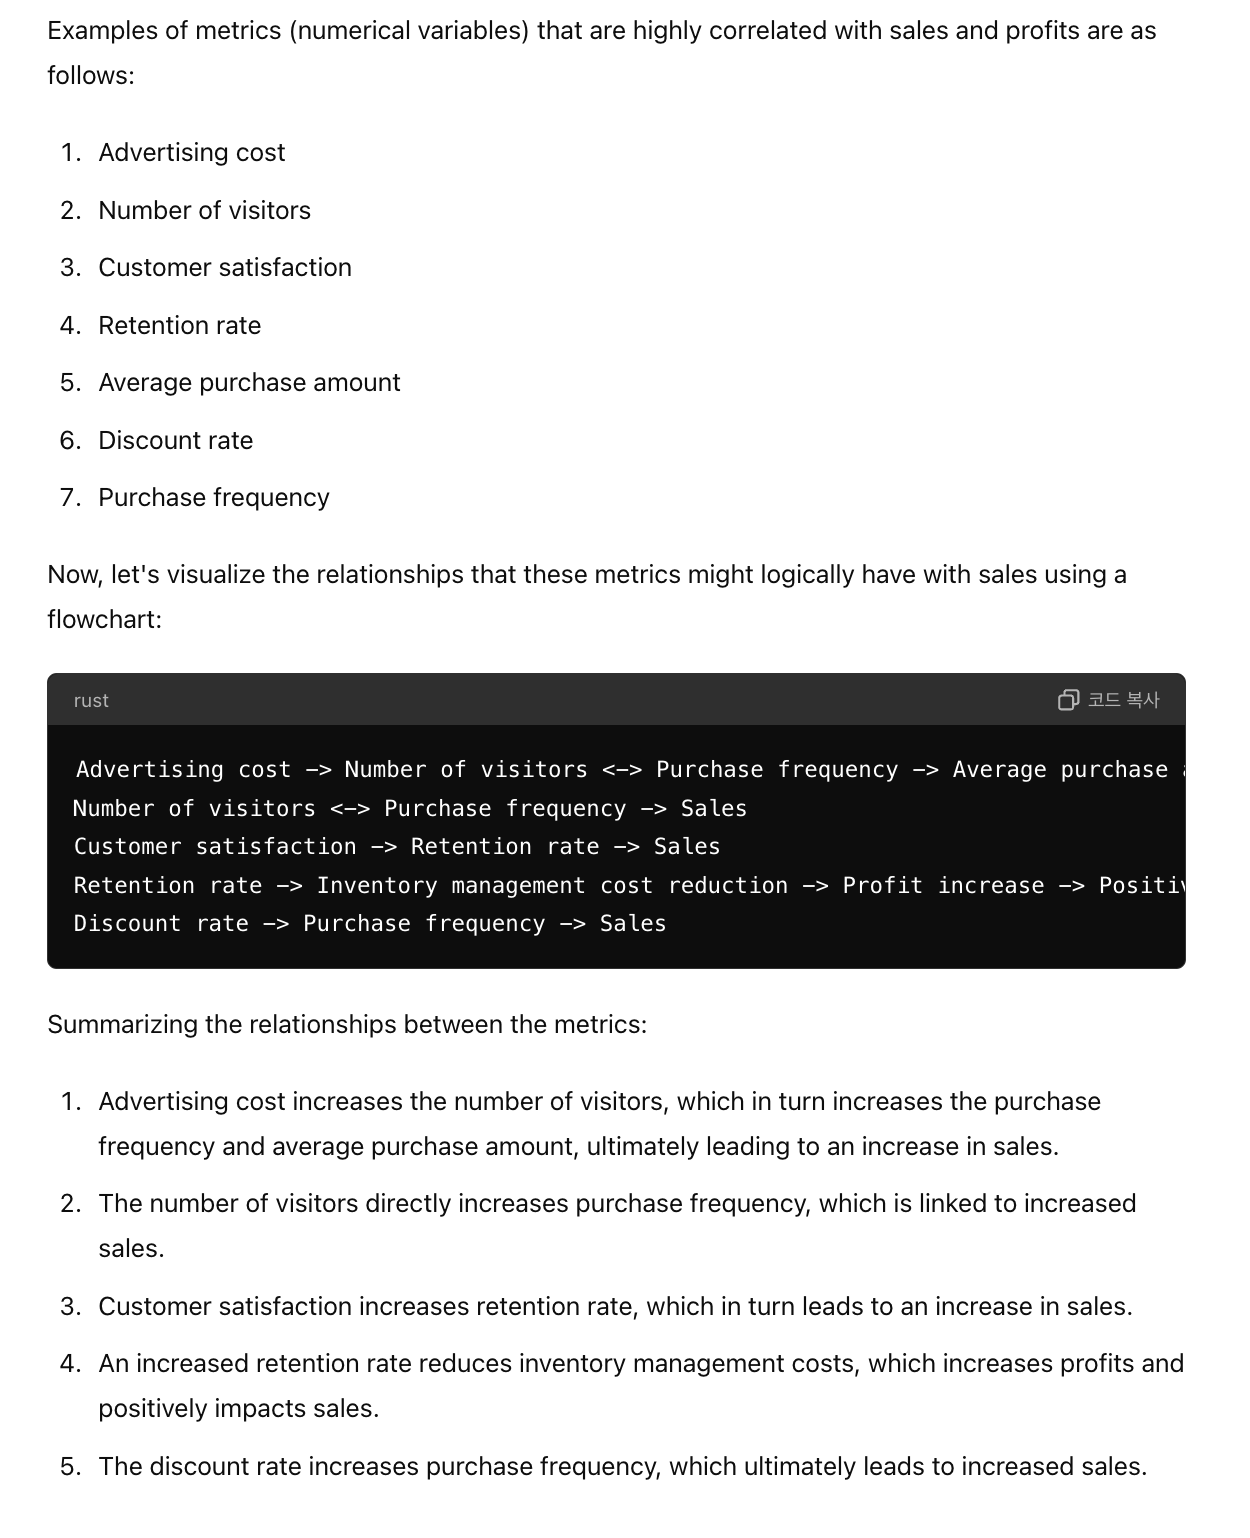
- Moreover, we plan to enhance the choices users make during the analysis process with Dialogue. Creating a data analysis report involves a series of decisions. We aim to smartly improve the default options users select from a metrics tree perspective. For example, if a user is interested in the 'sales' metric within a given dataset, the LLM’s language understanding can predictively link this metric to other potentially relevant metrics, as shown below:
Transforming Your Vague Questions into Excellent Analysis
The process of transforming business questions into analytical questions (Step 1 → Step 2) involves understanding the user's business language and converting it into analytical queries. This is where the language capabilities of LLMs can play a crucial role.
- Going forward, we will enable users to input their questions in business language directly. LLMs will then convert these into analytically appropriate questions, providing a guided journey that connects vague queries to domain-specific answers.
- Currently, Dialogue’s guided analysis paths might be limited and may not always lead to domain-specific answers. To address this, we will gradually expand our journey paths to cover more domains and develop the capability to answer user-inputted questions in natural language.
From Insights to Report Creation
To effectively utilize the conclusions reached through Dialogue in the user's business context, the analytical results need to be translated back into business language.
- A simple fact like "sales are unusually low in a certain region" needs to be turned into actionable insights, such as "additional promotional activities or inspections are needed in that region," to realize the full value of data analysis.
- While this requires a feel for the domain and business that cannot be entirely algorithm-dependent, LLMs can help synthesize fact statements (quantitative, accuracy/reliability critical) into domain-appropriate insights (qualitative, language ability critical).
- Ultimately, our goal is to help users quickly and easily move from accurate and reliable fact statements to well-synthesized insights through Dialogue. If we can also provide a draft of a data analysis report in a word processor format, that would be even better.
In Conclusion
HEARTCOUNT's new AI Analytics product, HEARTCOUNT Dialogue, is taking significant steps towards democratizing data analysis. By combining Dialogue's precise and reliable analytical reasoning capabilities with the language skills of LLMs, we aim to guide you from vague business questions to useful insights and comprehensive reports. This will make data analysis an accessible tool for 95% of users, not just experts.
HEARTCOUNT is a data analysis tool for everyone.
Log in with your Google account and start using it now.